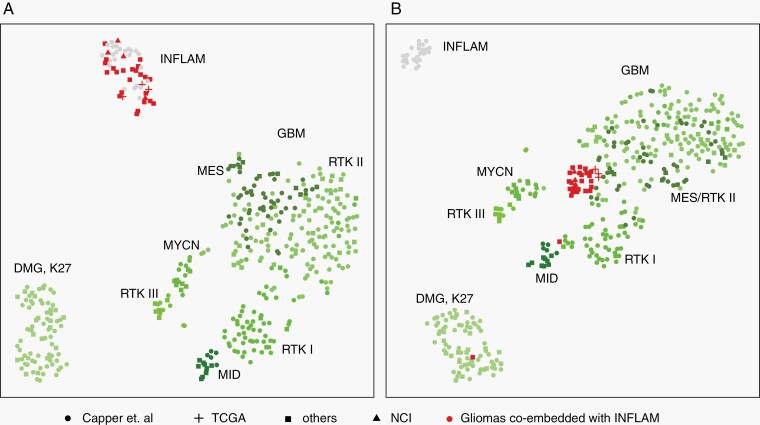
Fig. 5.
Tumor purity adjustment for inflammatory infiltrated gliomas improved tumor classification. (a) t-SNE plot of GBM, DMG-K27, control inflammatory tissue (INFLAM, gray dots), and a collection of gliomas co-embedded with inflammatory tissue (red) before (a) and after (b) tumor purity adjustment. Tumor purity was adjusted using the InfiniumPurify R package. Circle dot, cross, square, and triangle represent samples from Capper et al, TCGA, other public resources and our in-house samples (Supplementary Table S3).

