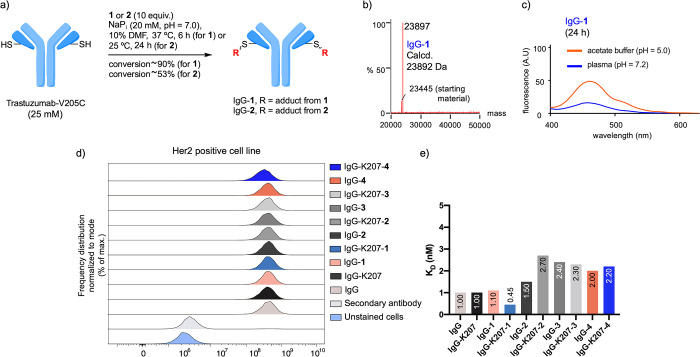
Figure 3.
(a) Optimized conditions for the preparation of IgG-1 and IgG-2. (b) ESI–MS spectrum of IgG-1. No modification of the heavy chain was observed (see also the Supporting Information). (c) Stability studies of IgG-1 followed by fluorescence. (d) Flow cytometry plots for the conjugates studied in this work obtained by flow cytometry with HER2-expressing cells (SKBR3 cell line, see also Figures S46 and S47). (e) KD constants derived from BLI experiments for the conjugates studied in this work with SKBR3 cell line. These values range from 0.45 to 2.7 nM, indicating that all conjugates have a similar binding (Figure S48).

