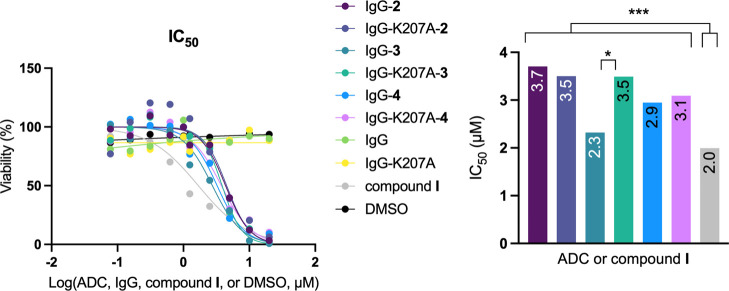
Figure 7.
Dose–response curves (left panel) and half maximal inhibitory concentration (IC50) values (right panel) of the different conjugates in the SKBR3 cell line. IgG, IgG-K207A, and DMSO were used as negative controls. Statistical analysis: all conjugates and compound I against their negative controls; p < 0.001. IgG-3 vs IgG-K207A-3; p = 0.0173 (*). All conjugates against compound I; p < 0.001 (***). All other comparisons; p > 0.05 (nonsignificant).

