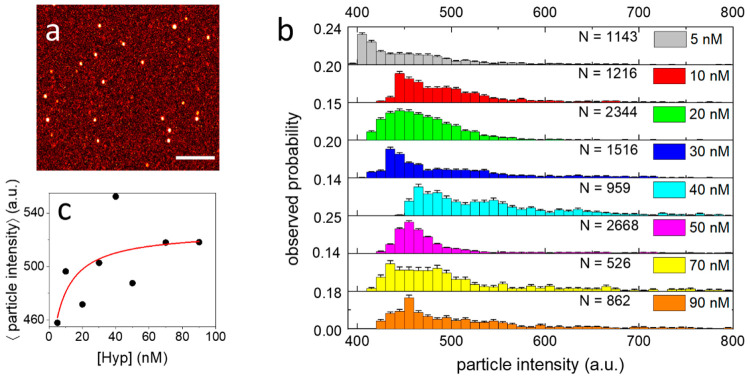
Figure 3.
(a) Representative image of SARS-CoV-2 particles exposed to Hyp, acquired for the analysis of single-particle intensity. Scale bar 5 μm. (b) Observed probability distributions of single viral particle fluorescence intensity obtained for the same amount of SARS-CoV-2 exposed to 5 nM (gray), 10 nM (red), 20 nM (green), 30 nM (blue), 40 nM (cyan), 50 nM (magenta), 70 nM (yellow), 90 nM Hyp (orange). N is the number of analyzed viral particles for each distribution. Bin width = 10 au (c) Average values of single viral particle fluorescence intensity measured at increasing Hyp concentration. The red line shows the result of the fitting with a binding model. Reported Hyp concentrations refer to the incubation with SARS-CoV-2.

