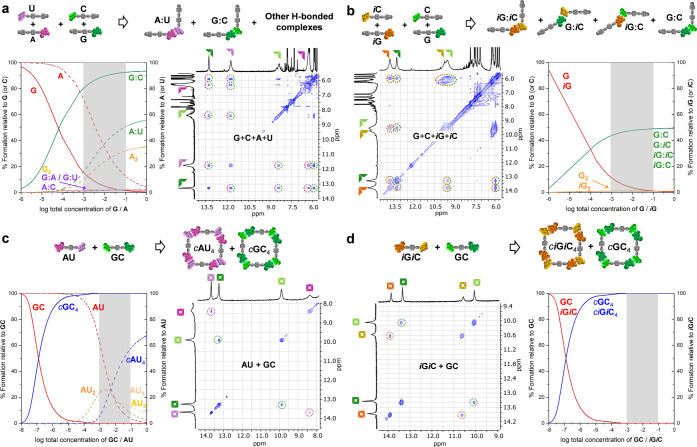
Figure 2.
Speciation curves and downfield region of the NOESY spectra of (a) a 1:1:1:1 mixture of G + C + A + U (CDCl3; 10–2 M; 298 K), (b) a 1:1:1:1 mixture of G + C + iG + iC (CDCl3; 10–2 M; 298 K), (c) a 1:1 mixture of AU + GC (CDCl3/CCl4 2:3; 10–2 M; 253 K), and (d) a 1:1 mixture of iGiC + GC (THF-D8; 10–2 M; 298 K). These NMR solvents were chosen either to (c) maintain a high association constant (K) between the corresponding Watson–Crick pairs and thus a high population of associated species, or (d) to conveniently dissolve the mixtures (see Figure S2C for more details). For proton NMR codes, see Figure 1. Speciation curves were simulated using reported association constants and effective molarities (see Section S1).37,45

