Fig. (2).
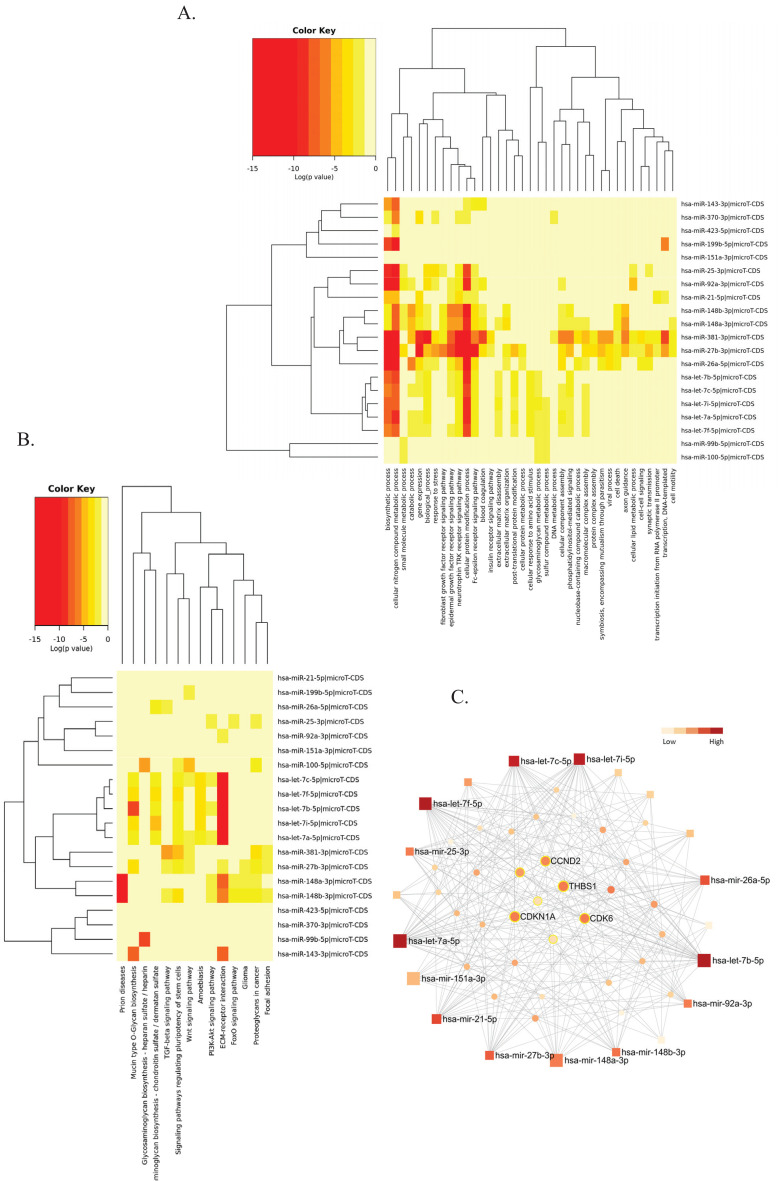
Pathway analysis of hOEC-EV- miRNA profile. (A) Gene Ontology categories of top 20 hOEC-EV-miRNAs constructed in the DIANA-mirPath v3. (B) Kyoto Encyclopedia of Genes and Genomes (KEGG) pathway analysis of top 20 hOEC-EV-miRNAs constructed in the DIANA-mirPath v3. (C) The minimum interaction network of top 20 hOEC-EV-miRNAs and their targets built in the miRNET 2.0. Square nodes represented the miRNA queries. Circle nodes represented predicted targets. The color key bar indicated the degree of interaction. The highly connected targets (high degree of interaction) were located in the middle of the network. The nodes of targets related to the p53 pathway were labelled with a yellow line (A higher resolution / colour version of this figure is available in the electronic copy of the article).

