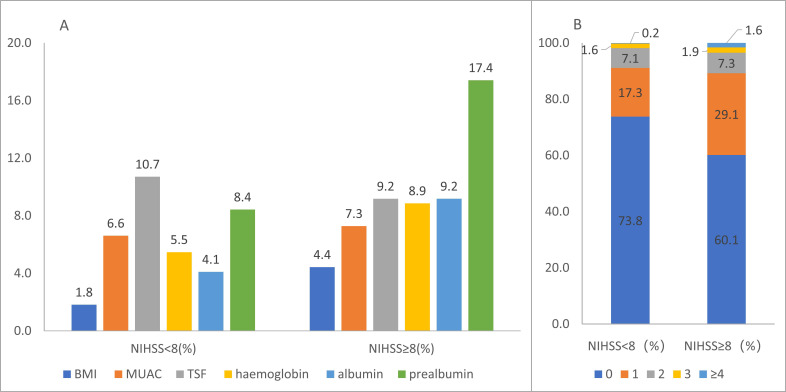
Fig. (2).
Nutrition status on admission in patients with stroke. Abnormal rate per nutrition indicator (A); percentage of abnormal nutritional indicators (B). The abnormal rate of each indicator ranged from 1.8 % to 10.7 % in the mild group and from 4.4 % to 17.4 % in the severe group. A total of 26.2 % of stroke patients had one or more abnormal nutrition indicators in the mild group and 39.9 % in the severe group. 0: without any abnormal nutritional indicators; 1: with one abnormal nutritional indicator; 2: with 2 abnormal nutritional indicators; 3: with 3 abnormal indicators; 4: with 4 or more abnormal nutritional indicators. Aberrations: BMI, body mass index; MUAC, mid-upper arm circumference; TSF, triceps skinfold thickness; NIHSS, national institute of health stroke scale (A higher resolution / colour version of this figure is available in the electronic copy of the article).

