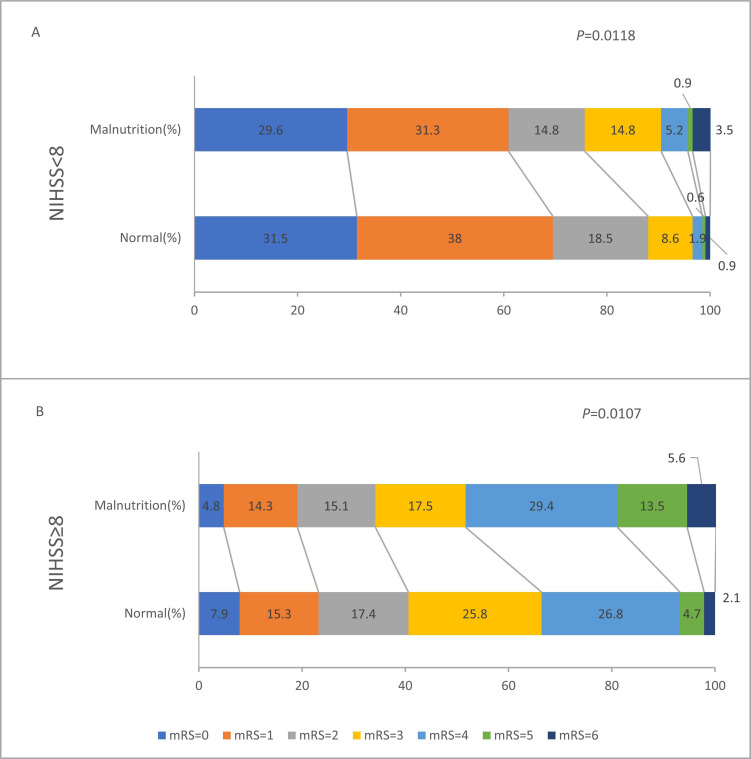
Fig. (3).
Comparison of score distribution of mRS at 3-month after onset in the mild group (A) and severe group (B). Patients with malnutrition had a worse shift of mRS score distribution both in the mild group (unadjusted P=0.0118) and in the severe group (unadjusted P=0.0107). Aberrations: mRS, modified Rankin score; NIHSS, national institute of health stroke scale (A higher resolution / colour version of this figure is available in the electronic copy of the article).

