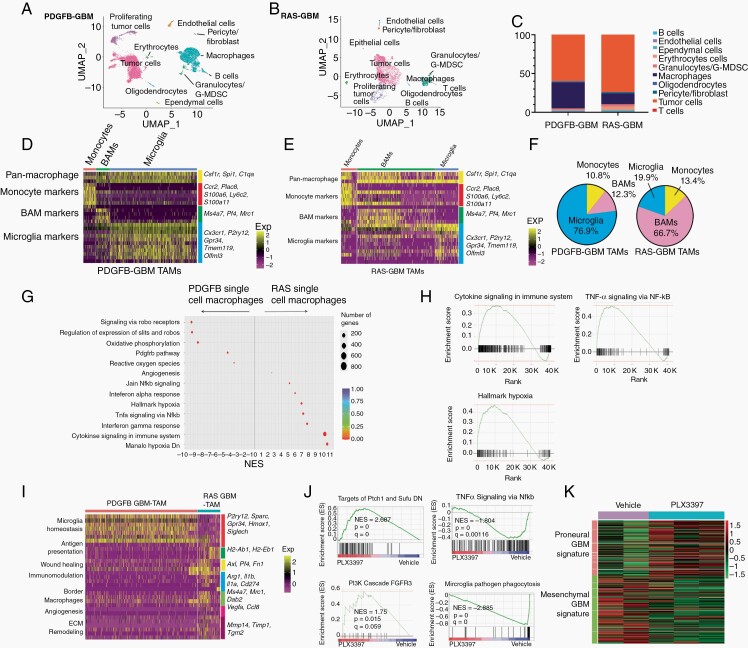
Fig. 4.
scRNA-seq reveals differences in TAM populations in RAS- and PDGFB-driven GBM. (A, B) UMAP plot of clusters derived from 10× Genomics profiling of end-stage PDGFB-driven tumors (A) and RAS-driven glioma (B). (C) Bar graph of distribution of cell types in the two glioma models. (D, E) Heatmap of expression of marker genes for monocytes, BAMs, and microglia in PDGFB-driven gliomas (D) and RAS-driven gliomas (E). (F) Pie chart showing subdivision of macrophage populations in the two GBM models. (G) Rich plot of differentially enriched terms between RAS-driven and PDGFB-driven glioma macrophages. (H) Plots of terms enriched in transcriptomes of macrophages from RAS-driven vs PDGFB-driven tumors. (I) Heatmap of differentially expressed genes in macrophages from PDGFB- and RAS-driven tumors. (J) Gene set enrichment analysis of gene expression between vehicle and PLX3397 treated RAS-GBM (n = 3 samples/group). (K) Expression of proneural and mesenchymal signature genes from RAS-driven tumors treated with vehicle or PLX3397. Abbreviations: BAMs, border-associated macrophages; GBM, glioblastoma; PDGFB, platelet-derived growth factor subunit B; TAMs, tumor-associated macrophages/microglia; UMAP, Universal Manifold Approximation and Projection.

