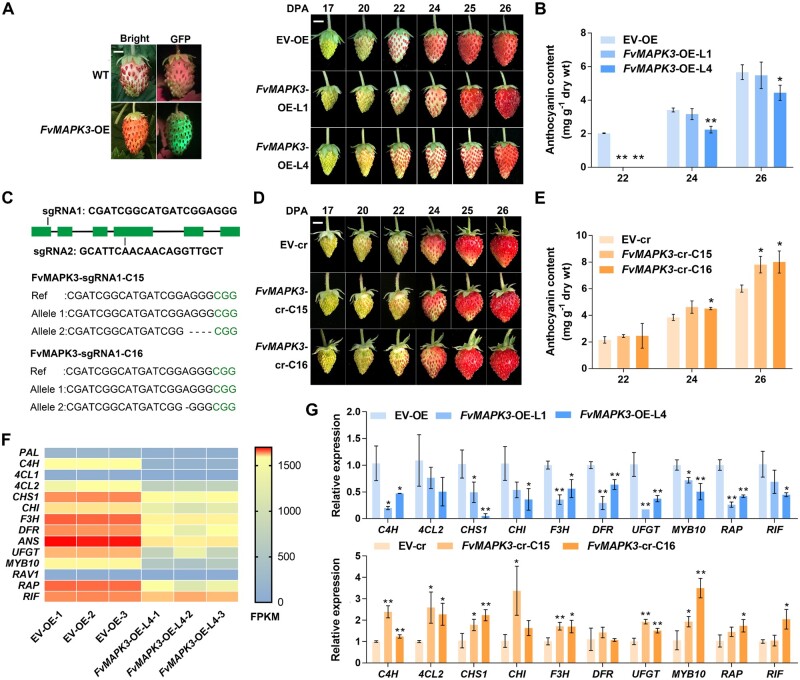
Figure 4.
FvMAPK3 negatively regulates anthocyanin accumulation in strawberry fruits. A, Visualization of GFP accumulation in FvMAPK3-OE fruits (left) and ripening phenotypes of EV-OE and FvMAPK3-OE-L1 and FvMAPK3-OE-L4 transgenic strawberry fruits (right). Fruits at 17, 20, 22, 24, 25, and 26 DPA are shown. Bars: 0.5 cm. B, Anthocyanin contents in EV-OE and FvMAPK3-OE-L1 and FvMAPK3-OE-L4 fruits at 22, 24, and 26 DPA. Error bars represent sem of three biological replicates. Statistical significance was determined by Student’s t test. *P < 0.05, **P < 0.01. C, Diagram of the FvMAPK3 locus and target sites for designed sgRNAs. Green boxes, exons; lines, introns. sgRNA1 and sgRNA2 were used for genome editing. Sequencing revealed successful genome editing at FvMAPK3 in lines C15 and C16, obtained with sgRNA1. D, Fruit developmental phenotypes of EV-cr and FvMAPK3-cr-C15 and FvMAPK3-cr-C16 transgenic strawberry fruits. Bar: 0.5 cm. E, Anthocyanin contents in EV-cr and FvMAPK3-cr-C15 and FvMAPK3-cr-C16 fruits. Error bars represent sem of three biological replicates. Statistical significance was determined by Student’s t test. *P < 0.05, **P < 0.01. F, Expression profiles of anthocyanin biosynthesis genes differently expressed between EV-OE and FvMAPK3-OE-L4 fruits, based on RNA-seq analysis of three biological replicates. The color scale was used to indicate FPKM values. G, Validation of relative expression levels of anthocyanin biosynthesis genes in EV-OE and FvMAPK3-OE-L1 and -L4, and EV-cr and FvMAPK3-cr-C15 and -C16 strawberry fruits by RT-qPCR. FvACTIN was used as internal reference. Values are means ± sem of three biological replicates. Statistical significance was determined by Student’s t test. *P < 0.05, **P < 0.01.

