Fig. 4.
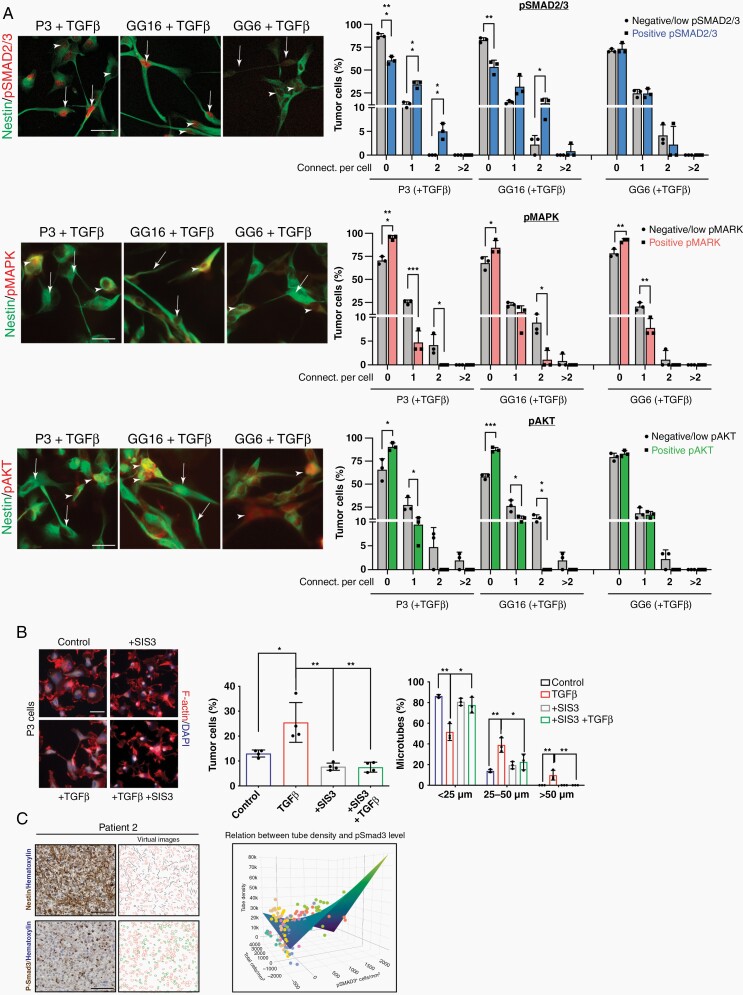
SMAD activation is important for MT formation. (a) Double immunofluorescence stainings of pSMAD2/nestin, pMAPK/nestin, and pAkt/nestin for P3, GG16, and GG6 cell lines are shown. Arrows indicate cells with MT formation. Arrowheads point to cells without MT formation. Quantification of connections per cell is presented. Scale bar 10 µm. *P < .05; **P < .01; ***P < .001. (b) SMAD inhibitor SIS3 inhibits MT formation under TGF-β1 stimulation. Immunofluorescence staining for F-actin is shown. Quantification of cells with MTs and MT length is presented. Scale bar 10 µm. *P < .05; **P < .01. (c) SMAD3 phosphorylation correlates with MT formation in GBM patient biopsies. Quantification of MT length on consecutive pSMAD3 immunostained and nestin immunostained sections of 1 patient (patient 2) is shown (see the Supplementary Methods for details). Images in the left column show original image data, images in the right column show visualizations of the quantifications. Black lines mark MTs, red outlines denote nuclei, and green outlines pSMAD3-positive nuclei. The graph shows the correlation of pSMAD3 expression with MT length using a linear mixed model. The surface shows the predicted value based on the fixed parameters of the linear mixed model. The results of all patients are included in the graph (each color refers to 1 patient; single graphs are shown in Supplementary Figure 6b). Scale bar 100 µm; P = .0013.

