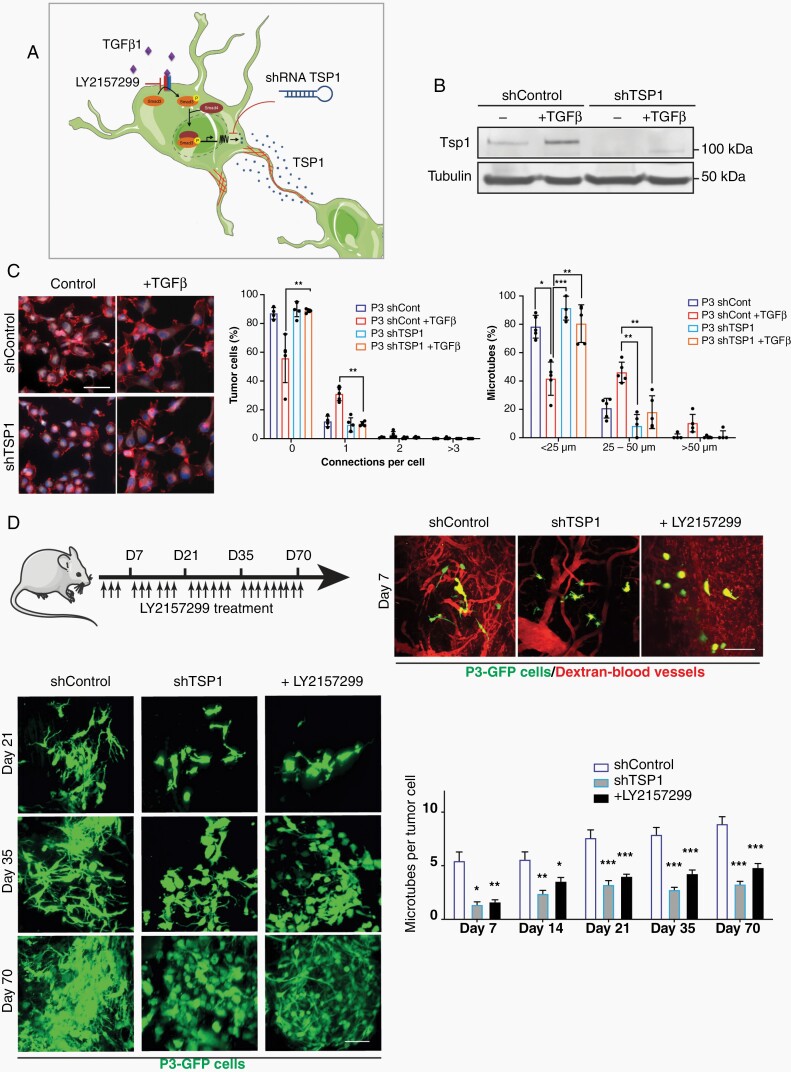
Fig. 6.
Inhibition of TSP1 reduces MT formation in vitro and in vivo. (a) Schematic figure showing upregulation of Tsp1 expression by TGF-β signaling through binding of pSMAD3 to the Tsp1 promoter. Tsp1 expression can be inhibited by LY2157299 or shRNA Tsp1. (b) Western blot of Tsp1 in P3 shControl and P3 shTsp1 with and without TGF-β1 stimulation. (c) MT formation is inhibited by shTsp1. Immunofluorescence staining for F-actin is shown. Quantification of connections per cell and MT length is presented. Scale bar 10 µm. *P < .05; **P < .01; ***P < .001. (d) Formation of MT network in vivo in the orthotopic P3-GFP GBM xenograft model was analyzed by intravital imaging. ShTsp1 and LY2157299 inhibit MT formation compared to shcontrol. Immunofluorescence pictures of intravital imaging are shown. Quantification of MT number per tumor cell is presented. Scale bar 150 µm. *P < .05; **P < .01; ***P < .001. Abbreviations: MT, microtube; TGF-β, transforming growth factor-beta; TSP1, thrombospondin 1.

