Fig. 3.
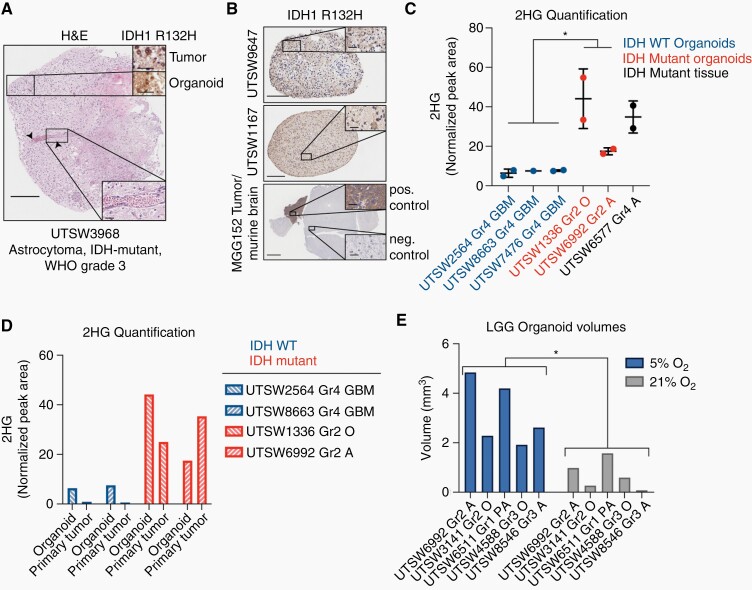
IDH1 oncoprotein expression and 2HG production are preserved in LGG organoids. (A) Main figure: H&E stain of an organoid derived from an IDH1 R132H-positive astrocytoma. Arrows denote a longitudinal vascular channel, which is shown at higher magnification in lower inset. Upper insets: IDH1 R132H oncoprotein detection by IHC in primary tumor and organoid tissues. Scale bars: main figure = 250 µm, insets = 50 µm. (B) IDH1 R132H oncoprotein IHC in two astrocytoma organoid models, UTSW9647 and UTSW1167, and in normal and malignant brain tissue in the MGG152 orthotopic xenograft model of astrocytoma, IDH-mutant, WHO Grade 4 (scale bars in main figures = 200 µm, 500 µm, and 2 mm, respectively). Scale bars in insets = 50 µm. Staining patterns in MGG152 tumor tissue and normal murine brain tissue serve as positive and negative controls, respectively. (C) LC-MS-based 2HG quantification in IDH-wildtype organoids (blue), IDH-mutant organoids (red), and an IDH-mutant primary tumor tissue sample (black, positive control). (D) LC-MS-based 2HG quantification in paired organoid and primary tumor tissues from selected specimens in C. Blue = IDH-wildtype, red = IDH-mutant. In parts C and D, values represent 2HG peak areas relative to that of an internal reference metabolite, N-acetyl-asparagine. (E) Organoids were cultured under either 5% (physiologic) or 21% (supraphysiologic) oxygen. Organoid volumes were calculated via microscopy. Abbreviations: Gr, Grade; GBM, glioblastoma; O, oligodendroglioma; A, astrocytoma; PA, pilocytic astrocytoma. In C, data are means ±standard deviation; two-tailed P value was determined by unpaired t-test. In E, two-tailed P value was determined by ratio paired t-test. *P < .05. Organoids were cultured for 4–6 weeks after explantation.

