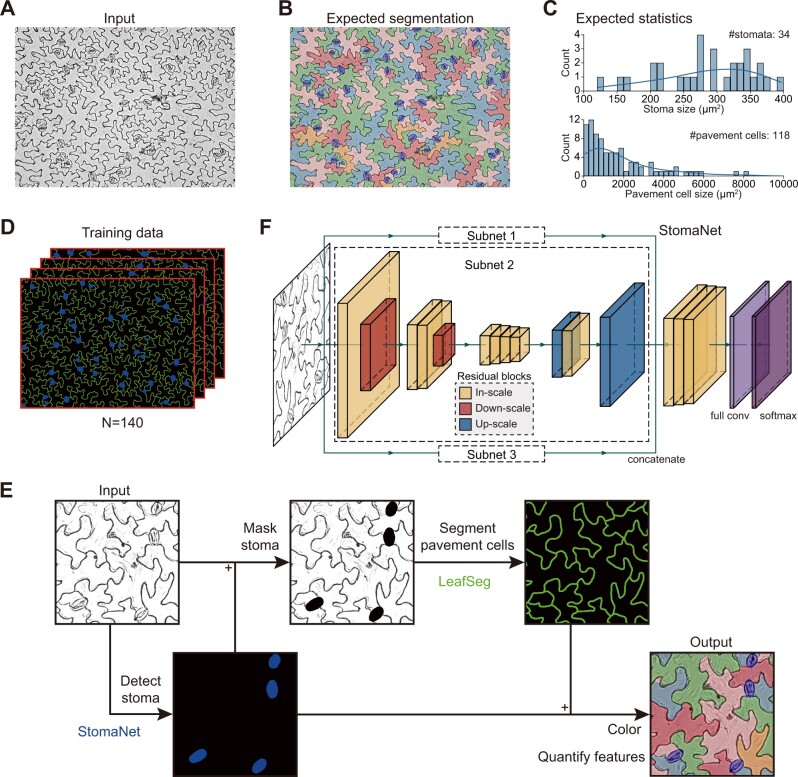
Figure 1.
Hierarchical strategy of LeafNet to segment stomata and pavement cells. A, Representative bright-field image of stomata and pavement cells. B, Representative result from manual segmentation of the input image in (A). Stomata are labeled in blue, and pavement cells are filled with different colors. C, Expected statistics from the segmentation in (B) on the size distribution for stomata (top) and for pavement cells (bottom). D, Training data prepared from manual segmentation. The stomata are shown in blue, and the borders of pavement cells are labeled in green. E, Hierarchical strategy and workflow of LeafNet with the StomaNet module for detecting stomata, and the LeafSeg module for segmenting pavement cells on stoma-masked input. A graphical illustration of each step is shown in Supplemental Figure S1. F, Graphical illustration of the deep residual neural network for the StomaNet module. This module is composed of three subnets with in-scale (orange), down-scale (red), and up-scale (blue) residual blocks.

