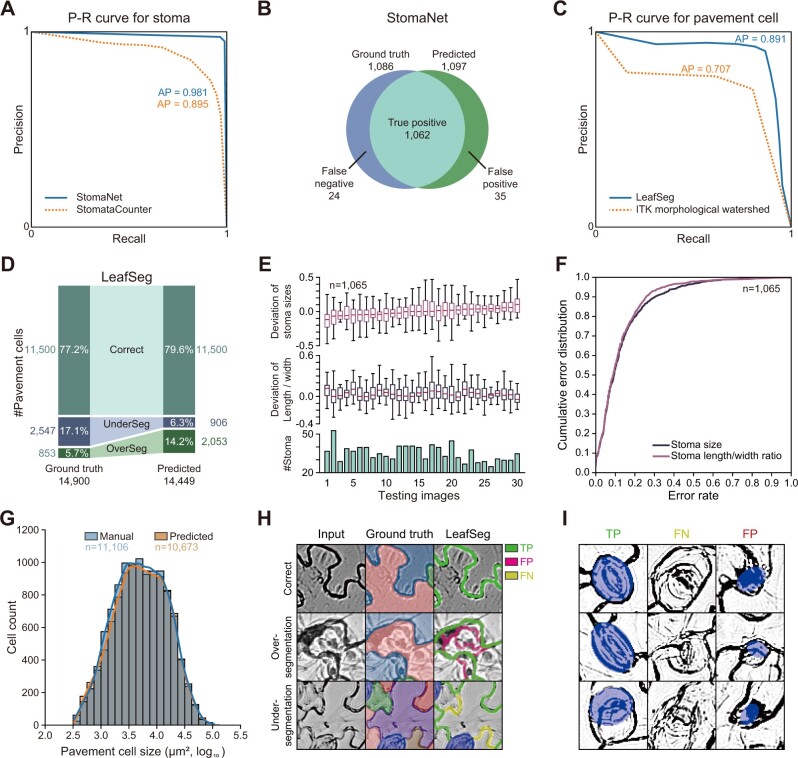
Figure 2.
Performance of LeafNet for the recognition and quantification of stomata and pavement cells. A, Precision-recall curve of StomaNet (blue) and StomataCounter (orange dotted line) for counting stomata in 30 testing images. The thresholds were evaluated from 0.1 to 0.9 to calculate AP. B, Venn diagram showing the performance of StomaNet for detecting stomata in the testing dataset using default settings. C, Precision-recall curve for segmenting pavement cells with LeafSeg (blue) and the ITK morphological watershed algorithm (orange). D, Performance of LeafSeg for segmenting pavement cells in the testing dataset using default settings. The numbers and percentages of correct, under-segmented (UnderSeg), and over-segmented (OverSeg) cells are shown. E, Deviation from the ground truth of the quantification of size (top) and length/width ratio (middle) for stomata in each image. The per-image counts of stomata are shown as a bar graph (bottom). F, Cumulative distribution of the size deviation (blue) and length/width ratio deviation (red) for all stomata (n = 1,065) in the testing dataset. G, Distribution of the pavement cell sizes obtained by manual annotation (blue) and LeafSeg prediction (orange). H, Representative examples of LeafSeg predictions in three cases: correct (top row), over-segmentation (middle row), and under-segmentation (bottom row). The middle column (Ground truth) shows the correct segmentation of cells filled with different colors. In the right column, the TP, FP, and FN borders are shown in green, magenta, and yellow, respectively. I, Representative stomata correctly identified (TP), missed (FN), and falsely identified (FP) by StomaNet.

