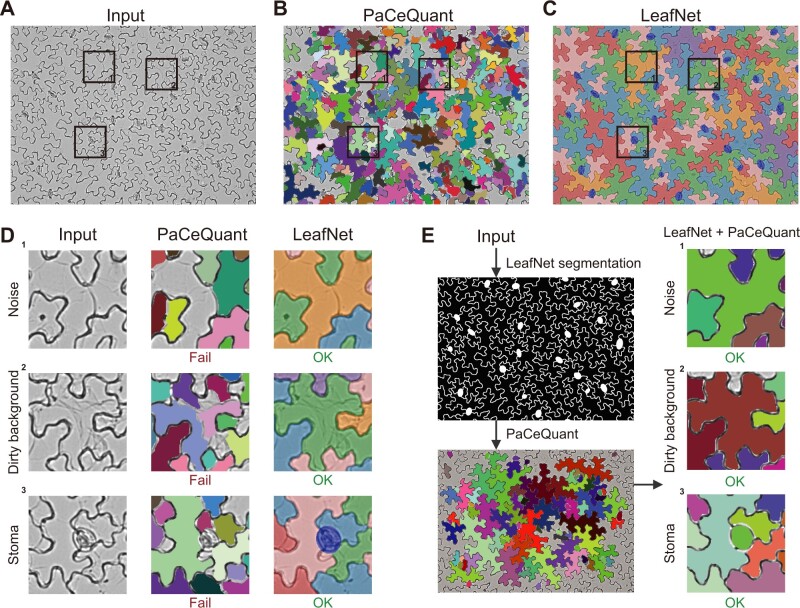
Figure 3.
Comparison of LeafNet with PaCeQuant. A, Representative raw input image with three areas highlighted in boxes. B, Results of segmentation of the image in (A) using the PaCeQuant program with the default configuration. Individual cells are filled with different colors. C, Results of segmentation of the image in (A) using LeafNet with the default configuration. Stomata are colored in blue, and neighboring pavement cells are filled with different colors. D, Zoom-in views of the three representative areas in the image in (A) showing typical noise and difficulties encountered in light microscope images. The raw input (left), segmented cells from PaCeQuant (middle), and those from LeafNet (right) are filled with different colors as in (B) and (C). E, Segmentation results of PaCeQuant using LeafNet’s segmentation as input (left). The combination of LeafNet and PaCeQuant achieved good results for the three representative areas, highlighting the advantages of LeafNet’s tolerance to various types of noise.

