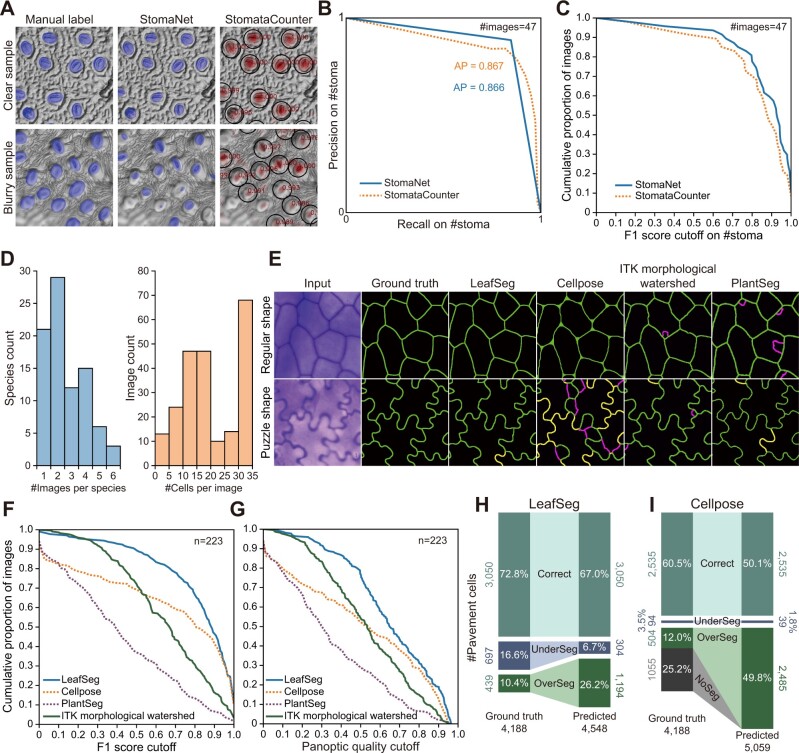
Figure 6.
Evaluation of complex datasets using LeafNet and other tools. A, Representative examples of the results of StomaNet and StomataCounter for evaluating StomataCounter’s dataset. StomaNet and StomataCounter both achieved high quality with stomata with clear boundaries (top) and suffered performance loss with blurry images (bottom). B, Precision-recall curve of StomaNet (blue) and StomataCounter (orange dotted line) for counting stomata in 30 testing images. The thresholds were evaluated from 0.1 to 0.9 to calculate AP. C, Cumulative distribution of F1 scores for stoma detection in all images of the stoma detection testing dataset (n = 47). D, The distribution of species counts by the number of images per species (left) and the distribution of image counts by the labeled cell counts per image (right). This pavement cell data set contains 4,188 cells in 223 images from 86 species. E, Representative examples of the segmentation results from different programs for regularly shaped (top) and puzzle-shaped cells (bottom). F and G, Cumulative distribution of F1 scores (F) and PQ scores (G) of pavement cell segmentation from different programs using the pavement cell segmentation testing dataset (n = 223). H and I, Performance of LeafSeg (H) and Cellpose (I) in segmenting pavement cells for a testing dataset from a wide range of species. The numbers and percentages of correct, under-segmented, and over-segmented cells are shown in the comparison of predictions to ground truth.

