Figure 7.
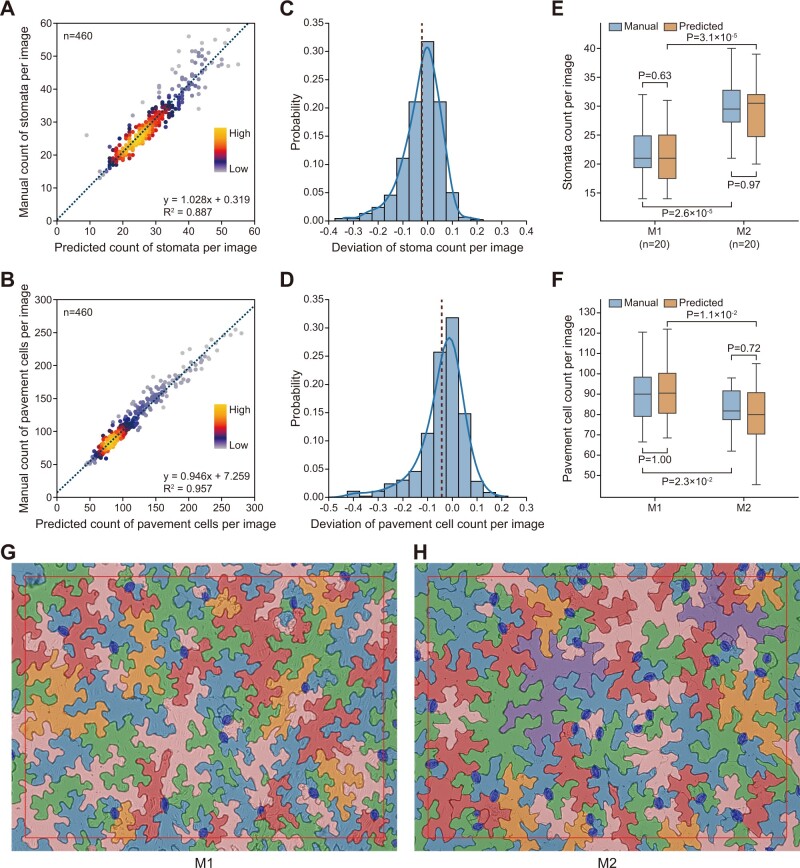
Application of LeafNet for evaluating large-scale microscope images. A and B, Linear regression between LeafNet’s results and manual counting of stomata (A) and pavement cells (B). The point densities are represented by heatmap with KDE smoothing. C and D, The deviation of stomata (C) and pavement cell (D) counts per image from LeafNet’s results versus manual annotation. E and F, LeafNet’s performance in quantifying the counts of stomata (E) and pavement cells (F) in leaves from two different genotypes: M1 and M2. P-values are based on paired two-tailed t test. G–H, Representative examples of LeafNet predictions using images from genotype M1 (G) and M2 (H).

