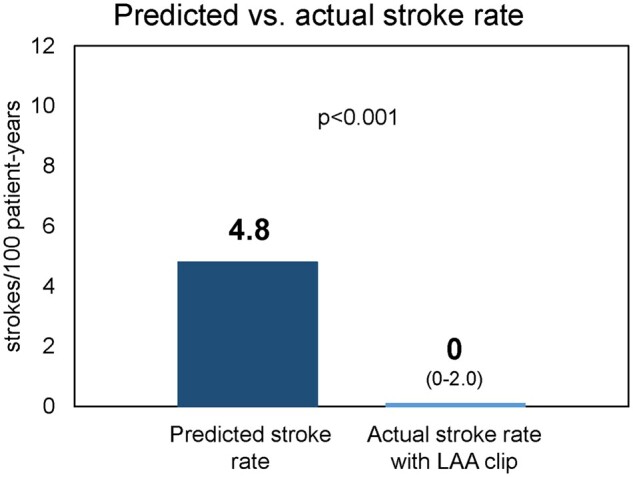
Figure 3:

Actual stroke rate with left atrial appendage clip exclusion compared to prognosis. The bar chart depicts the predicted stroke rate per 100-patient years based on CHA2DS2-VASc score compared to actual stroke rate during the study period (with 95% CI). P-value reflects Poisson exact test.
