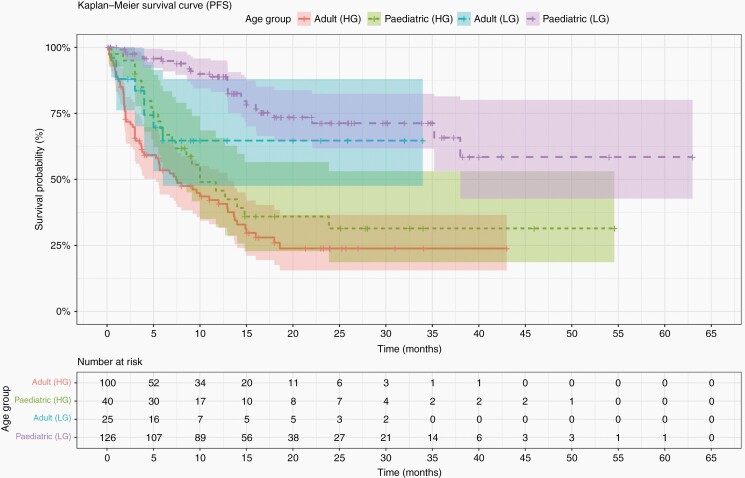
. 2021 Oct 28;24(4):528–540. doi: 10.1093/neuonc/noab247
© The Author(s) 2021. Published by Oxford University Press on behalf of the Society for Neuro-Oncology.
This is an Open Access article distributed under the terms of the Creative Commons Attribution-NonCommercial License (https://creativecommons.org/licenses/by-nc/4.0/), which permits non-commercial re-use, distribution, and reproduction in any medium, provided the original work is properly cited. For commercial re-use, please contact journals.permissions@oup.com

