Figure 8.
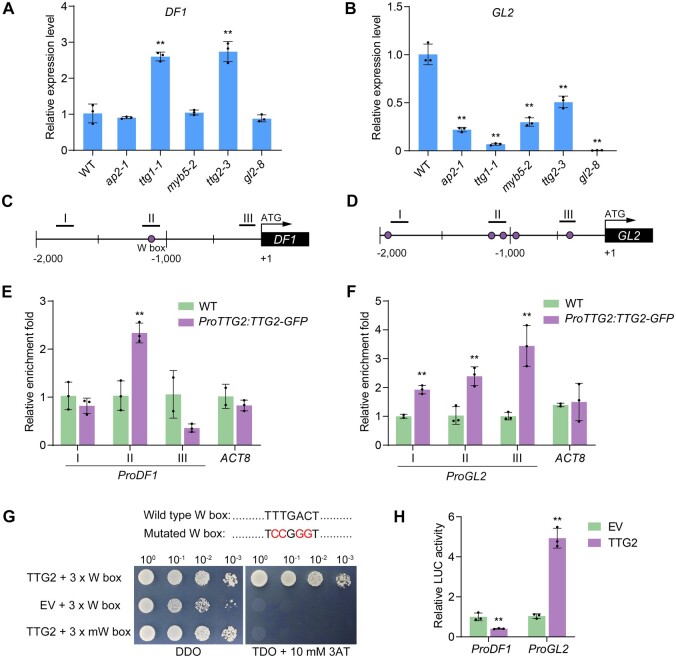
Expression of DF1 and GL2 are directly regulated by TTG2. A and B, Expression levels of DF1 (A) and GL2 (B) in the 7–10 DPA developing seeds of the ap2-1, ttg1-1, myb5-2, ttg2-3, and gl2-8 mutants. Data represent means ± sd of three biological replicates. Asterisks denote significant differences from the WT based on the one-way ANOVA and Dunnett's multiple comparison test (**P < 0.01). C and D, Schematic illustration of the promoters of DF1 (C) and GL2 (D) and the positions of the W boxes. I–III indicate the regions tested in the ChIP-qPCR assay. E and F, Binding of TTG2 to the DF1 promoter (E) and GL2 promoter (F) in vivo examined by ChIP-qPCR assay. ACT8 was used as a negative control. Error bars indicate the sd of three biological replicates. Asterisks denote significant differences from the WT (**P < 0.01, Student’s t test). G, TTG2 binding to the W box in vitro detected by Y1H assay. pHIS2.1-3×W box cotransformed with the EV and AD-TTG2 cotransformed with the mutated W box were used as negative controls. DDO and TDO represent SD-Trp-Leu and SD-Trp-Leu-His medium, respectively. H, Dual-LUC reporter assays showing that TTG2 directly suppresses DF1 expression and activates GL2 expression. Asterisks denote significant differences from the EV control (**P < 0.01, Student’s t test).

