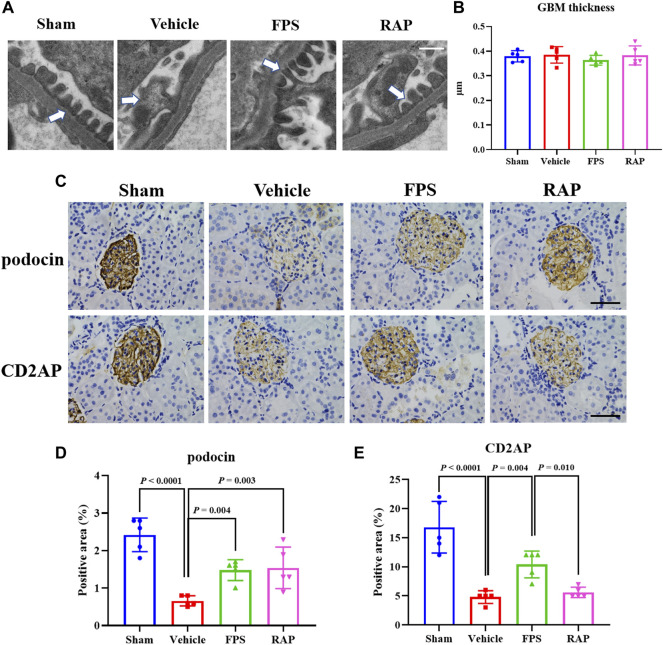
FIGURE 4.
Effects of FPS and RAP on foot process form, GBM thickness, and the expression characteristics of podocin and CD2AP in vivo. (A) The ultra-microstructure of foot process form and GBM (×11,500). Scale bar = 500 nm. (B) The GBM thickness. (C) The immunostaining of podocyte and CD2AP in glomeruli (×400). Scale bar = 50 μm. (D,E) The positive area of podocin and CD2AP in glomeruli. The data are expressed as the mean ± SD.

