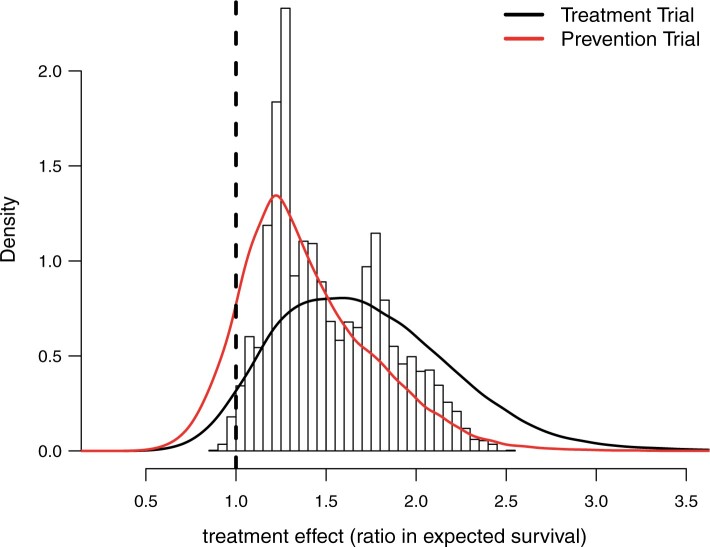
Fig. 2.
Histogram of point estimates (i.e. posterior means) of the treatment effects
 and smooth posterior estimates
  of the treatment effect
distribution. The histogram is constructed using all point estimates from both the
SOLVD treatment and prevention trials. Smooth estimates,
  , of the distribution of
treatment effects were computed as described in equation (3.5) for the two trials
separately. The kernel bandwidth
  for each trial was chosen using
the rule
  ,
where
  and
and
 are posterior means of
the standard deviation and inter-quartile range of
  respectively and
where
  is the trial-specific sample
size.

