
Fig. 7. ONECUT2 level in tumor is regulated by chemotherapy through EV secretion and affects therapeutic response.
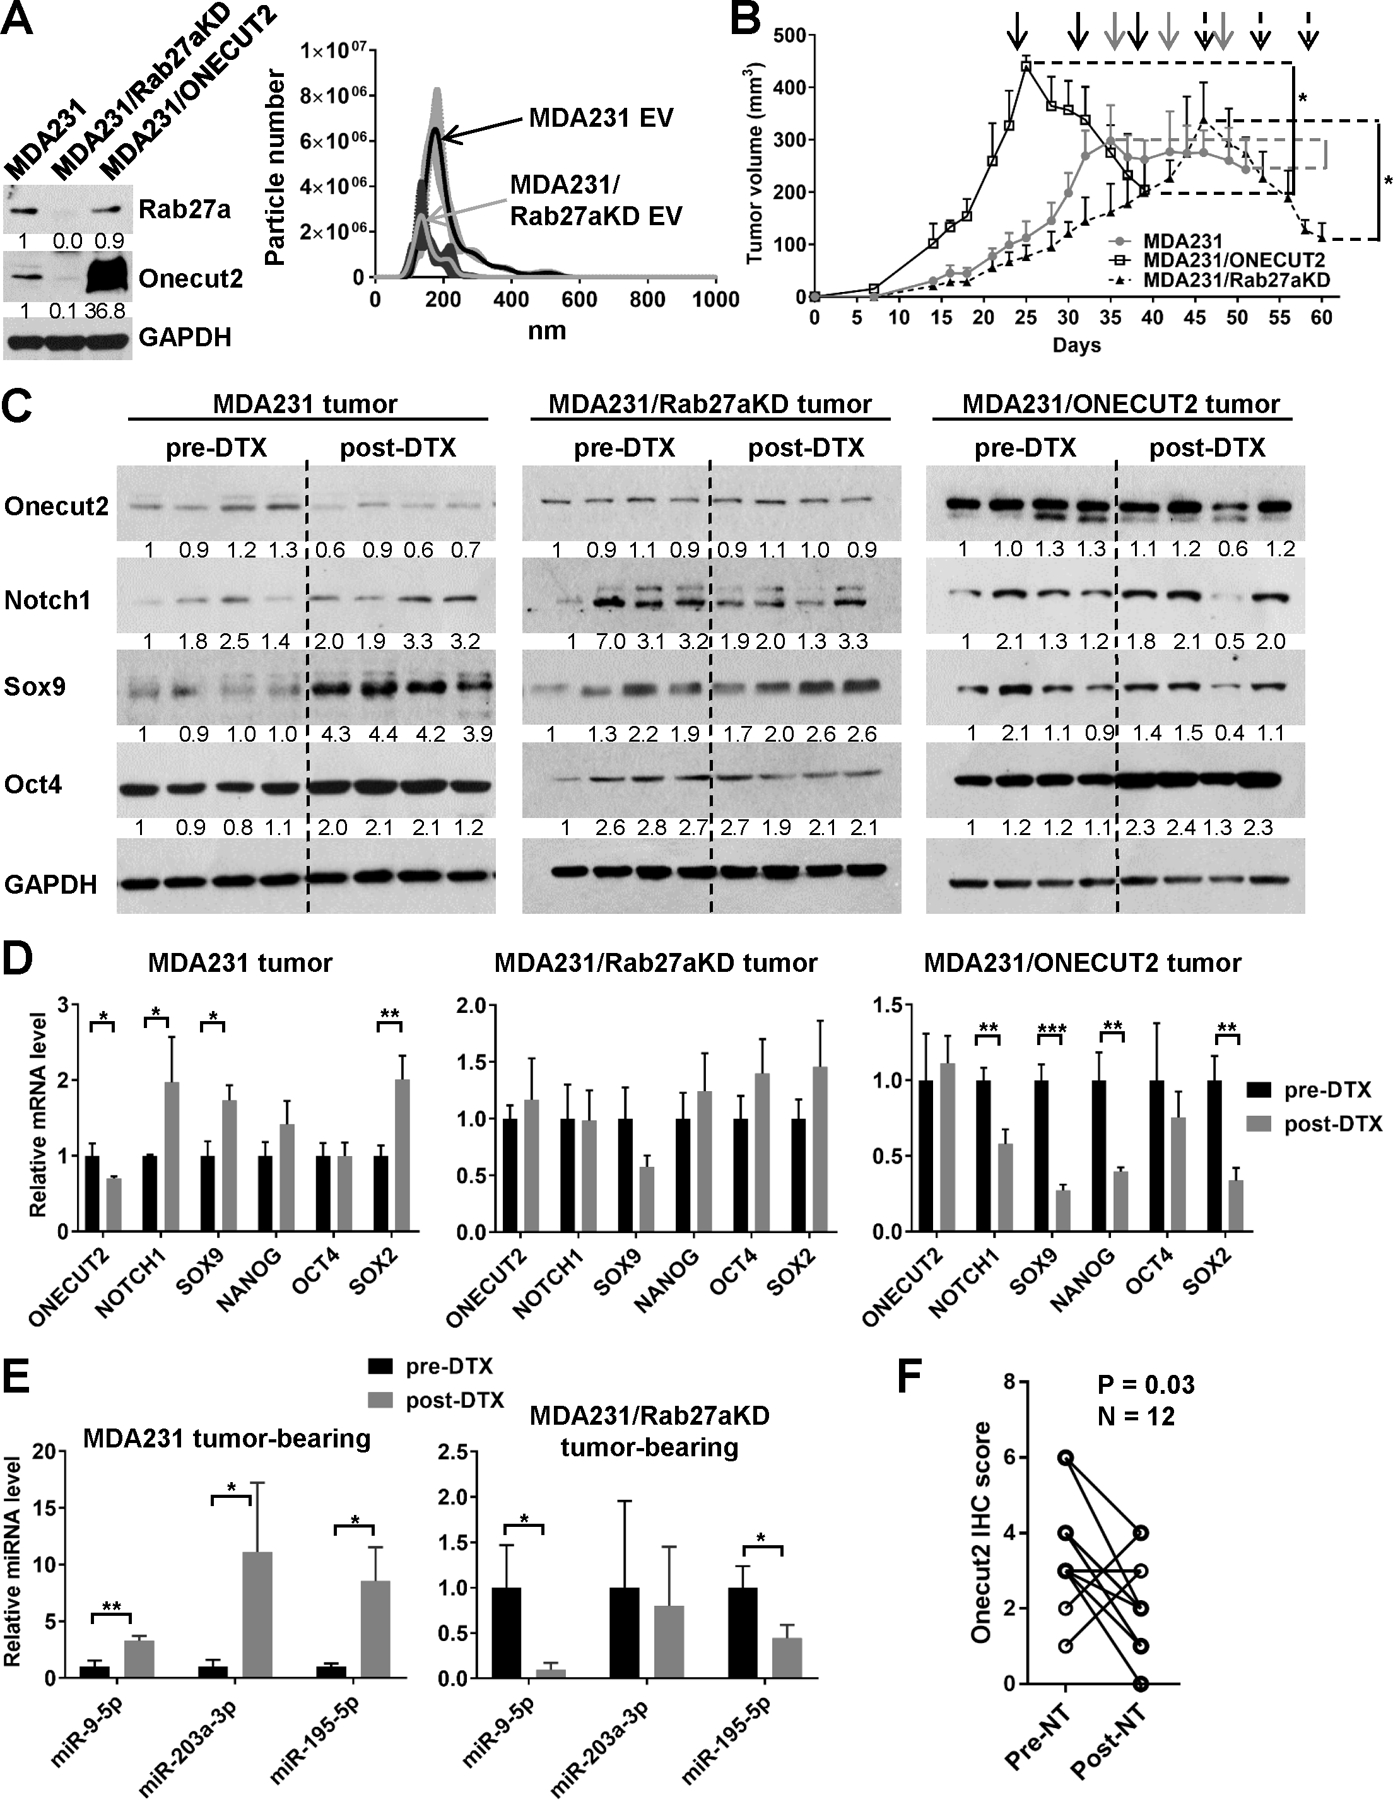
(A) Left: Western blots showing modified expression of Rab27a and Onecut2 in indicated cell lines. Right: nanoparticle tracking analysis of EVs from an equal number of producing cells showing reduced EV secretion by MDA231/Rab27aKD cells. (B-E) Xenograft tumors were established in NSG mice by injecting 2×10⁵ of indicated cells into the #4 mammary fat pad. When tumor size reached ~300 mm3, mice were treated weekly with DTX (15 mg/kg) for 3 weeks. (B) Tumor onset and volume. The time of DTX treatments were indicated by arrows. (C) Western blots of indicated proteins using tumors collected before and after DTX treatment. Numbers below Western images indicate quantification after normalization to GAPDH with the first lane set as 1. (D) RT-qPCR analysis of indicated genes using tumors collected before and after DTX treatment. (E) EVs were prepared from the sera of indicated mice before and after the 3-week DTX treatment. Levels of miRNAs were determined by RT-qPCR using a cel-miR-39–3p spike-in control for normalization. (F) Twelve pairs of pre- and post-NT human breast tumors were analyzed by IHC to determine the ONECUT2 expression levels in tumor cells. Wilcoxon test was performed. *P<0.05, **P<0.01, ***P<0.001.