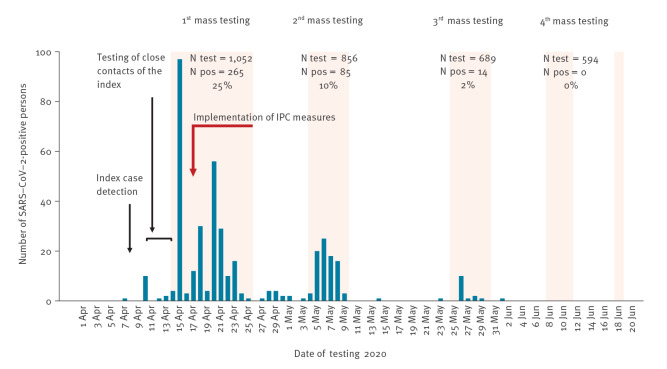
Figure 2.
Epidemic curve by PCR testing date of SARS-CoV-2 positive cases in the meat processing plant outbreak
Blue bars represent SARS-CoV-2 positive cases working in meat processing plant. Light orange rectangles represent screenings delegated by the local health authorities in the meat plant. Red arrow depicts timeline when infection prevention and control (IPC) measures were progressively implemented. The epidemic curve shows only cases detected by PCR.

