


Fig. 4.
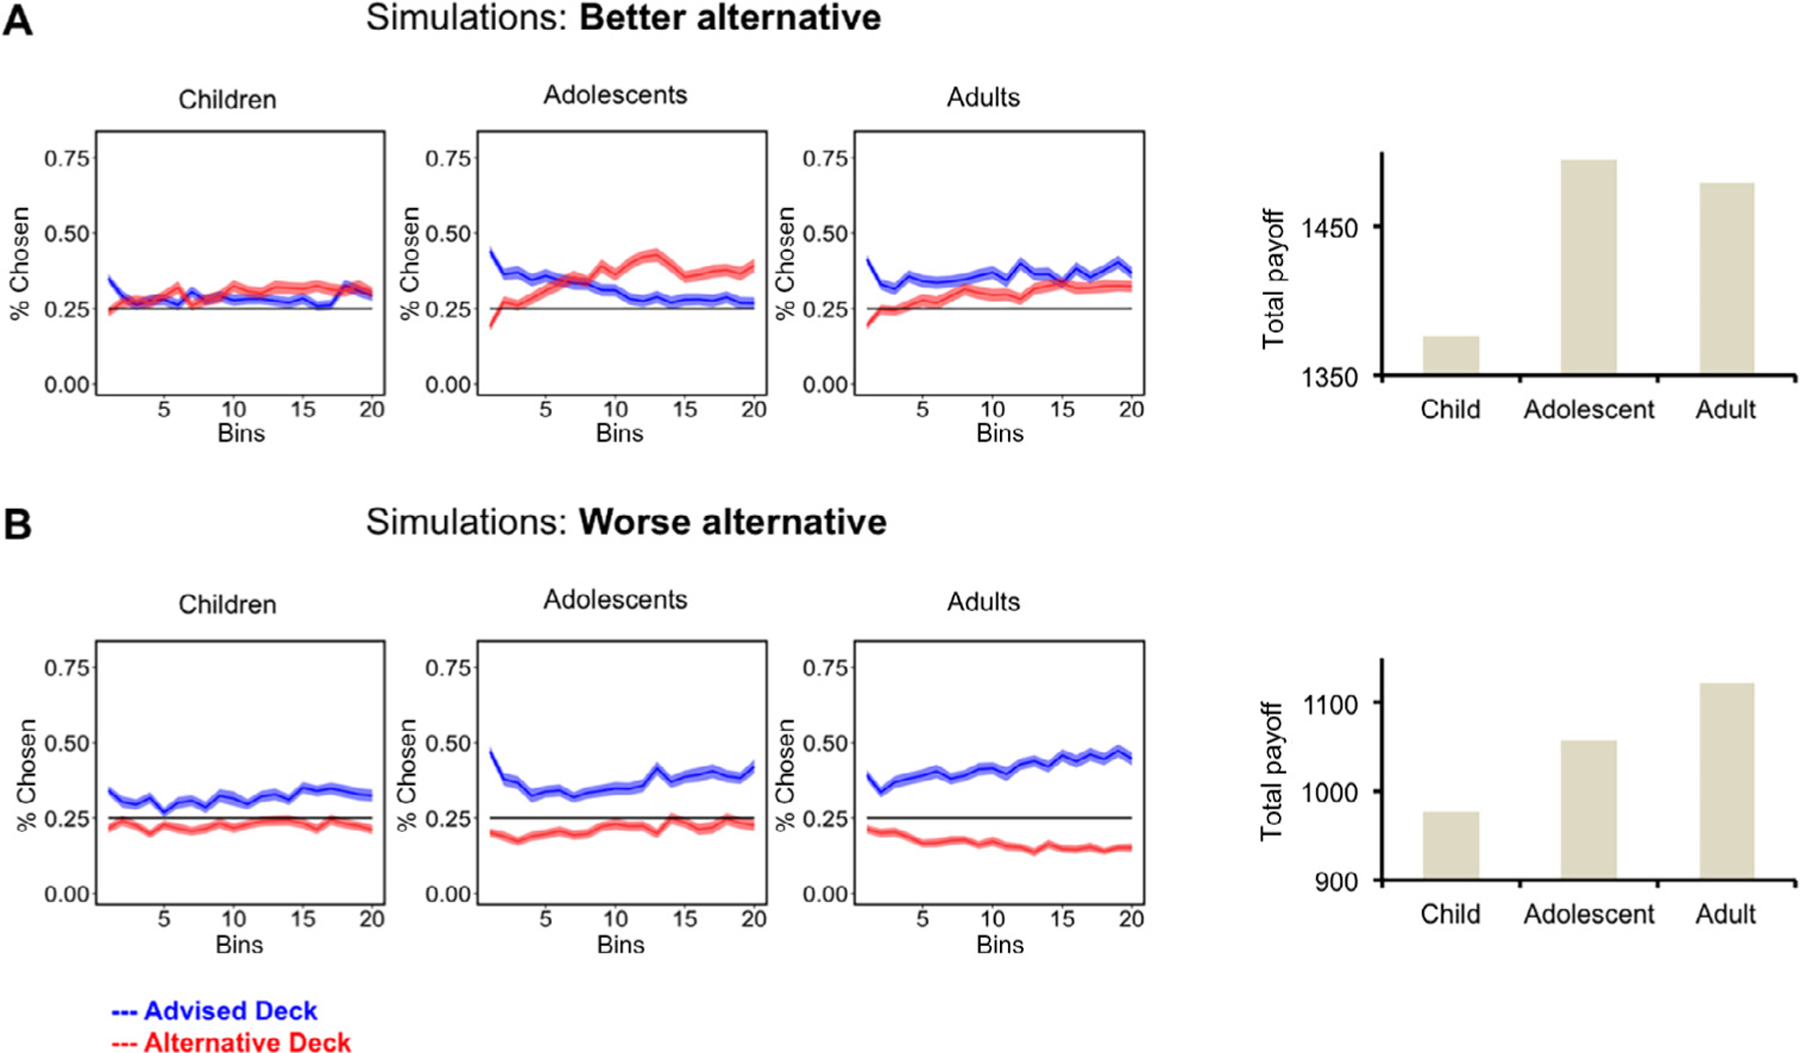
Model simulations. Simulated data using the best-fitting model and the median parameter values for each group are shown. The simulations are the result of 210 trials and 100 iterations. Shaded areas represent standard errors. (A) Simulation: Better alternative. Simulations in an environment where the other good deck was better than the recommended deck are shown. That is the expected value (EV) was slightly higher for the other good deck (EVadvised = 10 and EValternative = 12.5). The blue line represents choices from the recommended deck, and the red line represents the better alternative. Total payoff per age group for the better alternative is shown. Payoff is calculated by multiplying the percentage of choices per deck times the expected value (times number of trials [n = 210]). When there was a better alternative, the adolescents had a slight advantage over the adults. (B) Simulation: Worse alternative. Simulations in which the recommended deck was better than all other decks are shown. Again, the blue line is the recommended deck (EVadvised = 10) and the red line is the worse alternative (EValternative = 7.5). Total payoff per age group for the worse alternative is shown. Payoff is calculated by multiplying the percentage of choices per deck times the expected value (times number of trials [n = 210]). (For interpretation of the references to color in this figure legend, the reader is referred to the Web version of this article.)