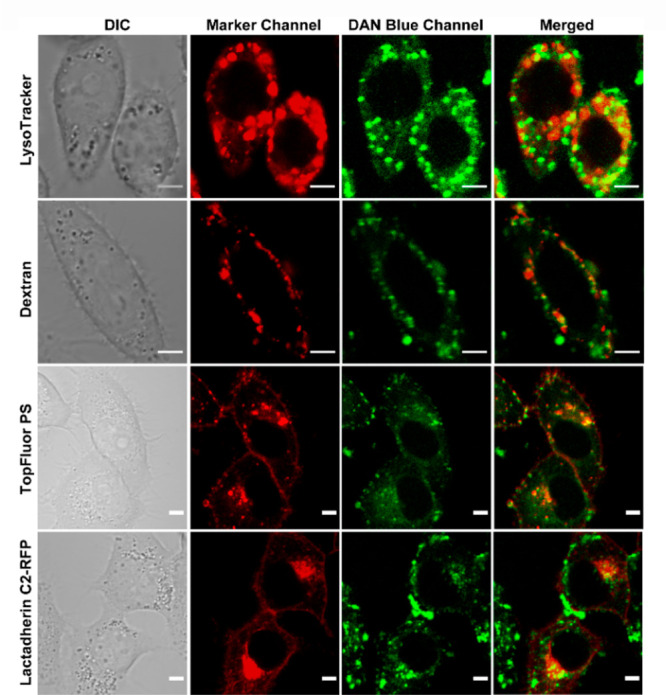
Figure 4.

Representative confocal single z-plane images of living HeLa cells incubated with LysoTracker Red (200 nM, 30 min), Dextran AlexaFluor 546 (10 μM, 4 h), or TopFluor PS (2.7 μM, 15 min, 0 °C) or transfected with Lactadherin C2-RFP plasmid and incubated with DAN-APS (7 μM, 15 min) at 37 °C in DMEM, pH 7.4, with no phenol red and serum, and washed. The cells were irradiated with λex of either 561 nm (for Lysotracker, Dextran, and Lactadherin C2-RFP) or 488 nm (for TopFluor PS) and a two photon laser (λex: 780 nm) for DAN-APS. The fluorescence emissions at the marker channel (for Lysotracker and Dextran, λem: 570–650 nm; TopFluor PS, λem: 500–550 nm; Lactadherin C2-RFP, λem: 570–700 nm) and blue channel for DAN-APS (λem: 420–460 nm) were collected successively. Scale bar, 5 μm. The colocalization of organelle trackers and PS markers (red false-color) with DAN-APS (green false-color) is depicted by yellow spots in merged panel. DIC images in left column.
