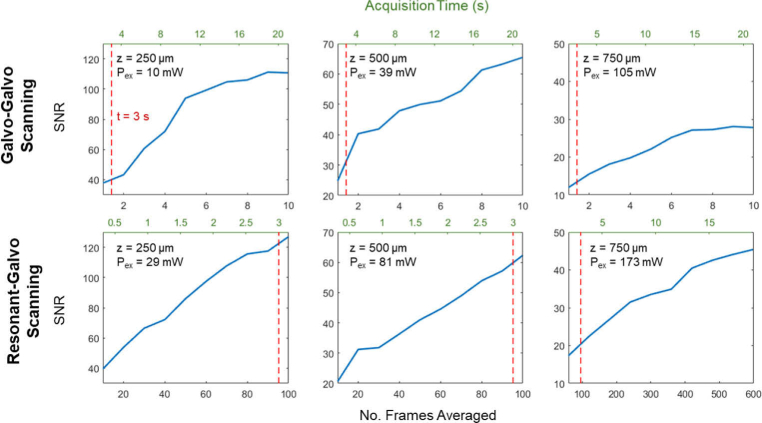
Fig. 4.
Comparison of SNR against number of frames averaged and corresponding acquisition times for resonant-galvo and galvo-galvo scanning methods. Each SNR value plotted is the average SNR across three representative vessels chosen at each depth z, (250, 500, and 750 µm), for which line profiles were analyzed at each level of frame averaging. Red dashed lines mark acquisition time t = 3 s, for reference across plots. Pex is the excitation power at the sample for each acquisition. The frame rates were 0.48 Hz for GG scanning and 27 Hz for RG scanning.

