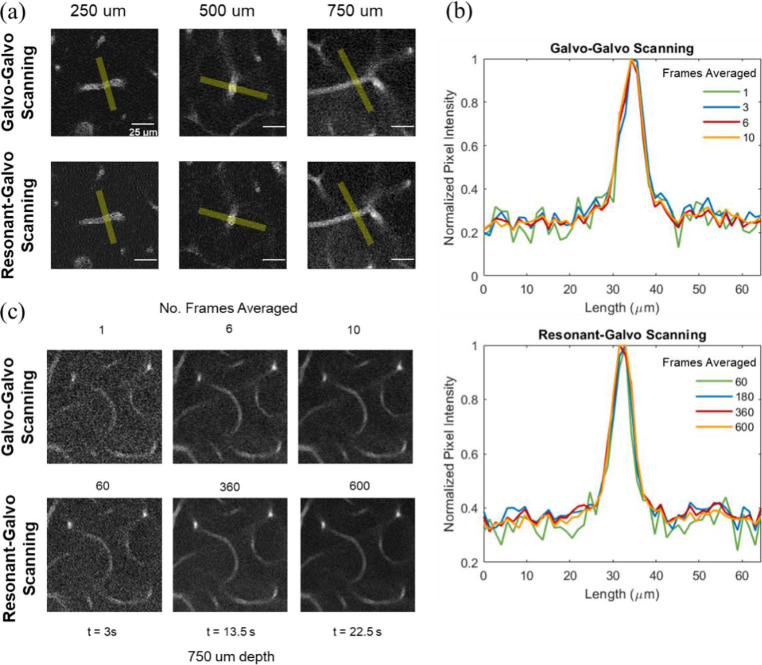
Fig. 5.
(a) Sample vessels and line profiles shown in yellow (approx. 7 µm x 65 µm) at each depth for RG and GG scanning. Frame averages chosen for each image to yield SNR of approximately 35. (b) Line profile comparisons across different frame averaging for vessel shown at 750 µm depth in (a) for GG and RG scanning. Values of frame averaging shown in legend correspond to identical image acquisition times for each line color in legend across two the scanning methods. (c) Visual comparison of image quality at 750 µm depth across the two scanning methods for acquisition times of 3, 13.5 and 22.5 seconds.

