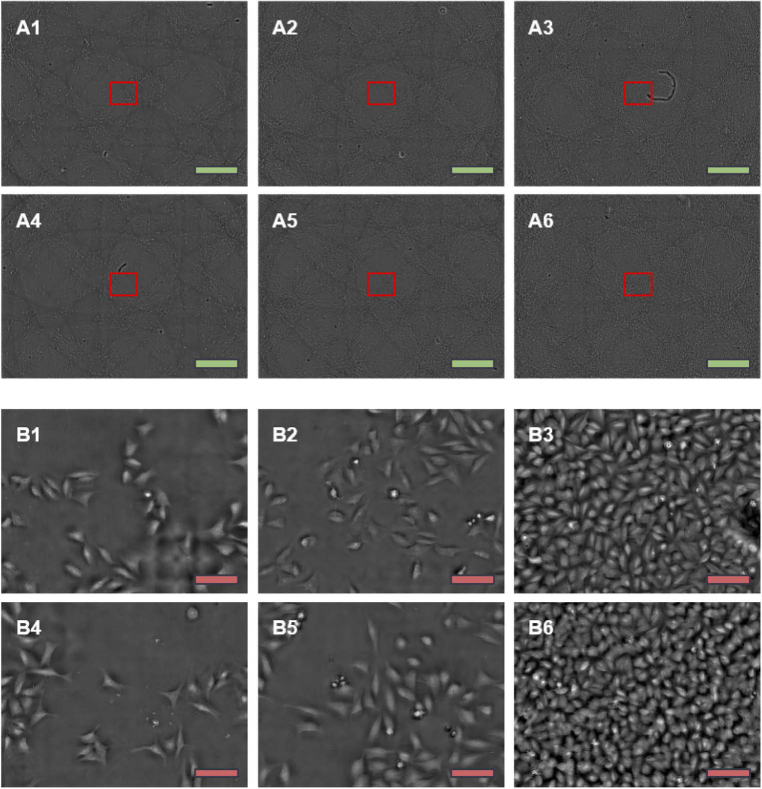
Fig. 1.
Example 6-well microplate with different U2OS cell densities imaged on the SimulPhi-6 system. All images in this figure were captured after fixation. Images A1 to A6 show full field of views for wells 1 to 6, respectively. Low, medium, and high cell densities are captured in the left column (A1 and A4), the middle column (A2 and A5), and the right column (A3 and A6), respectively. Images B1 to B6 show zoomed-in regions from images A1 to A6, respectively, as indicated by the red rectangles. Green scale bars represent 1 mm. Red scale bars represent 100 µm. The large-scale overlapping ‘weave’ pattern seen in images A1 to A6 is an artifact of FPM illumination.

