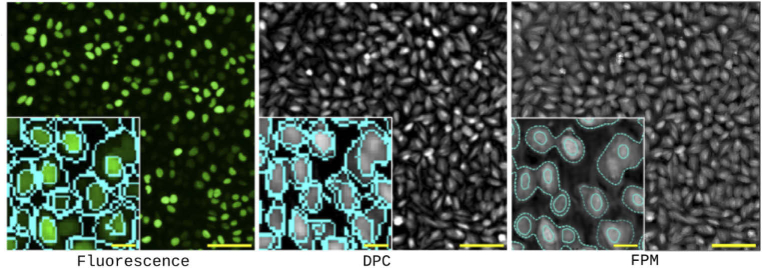
Fig. 4.
Segmentation of U2OS cells (at high density) across the three imaging modalities, SYTO 24 fluorescence, DPC, and FPM. Insets for the fluorescence and DPC images show zoomed-in regions with segmentation overlays from Columbus (cyan inner: nucleus; outer: cell). The inset for the FPM image shows a zoomed-in region with overlay from QPI segmentation. Dashed lines are used in the FPM output to show the boundary-region segmentation, while the Columbus output has these rendered as solid lines. All larger image scale bars represent 100 µm. All inset scale bars represent 20 µm.

