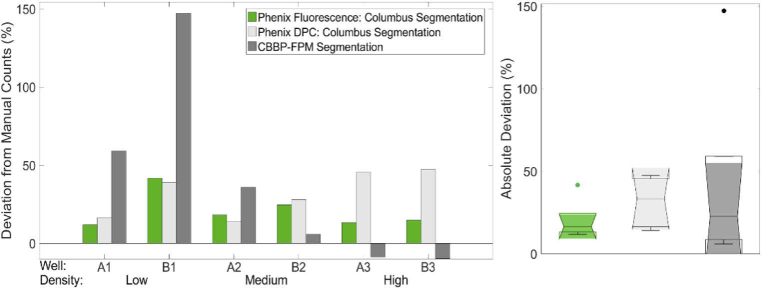
Fig. 8.
Cell counting results from three different iPSC-CM cell seeding densities and the different imaging modalities. Each of these seeding densities includes two wells at the low (A1 and B1), medium (A2 and B2), and high (A3 and B3) densities, as defined in Section 4.3. Positive deviation indicates the segmentation method produced higher cell counts than manual fluorescence-based counts, whereas a negative deviation indicates fewer cell counts than manual fluorescence-based counts. The box plots on the right show the summarized absolute deviations from manual counts for each of the different imaging modalities. The notches for all three box plots overlap and thus the true medians do not differ with 95% confidence. Overall average deviations for each imaging modality: fluorescence 20.8 ± 11.2%, DPC 31.7 ± 14.5%, and FPM 44.4 ± 54.5%. Excluding the outlying deviation from well B1, the average deviation for FPM improves to 23.9 ± 23.1%.

