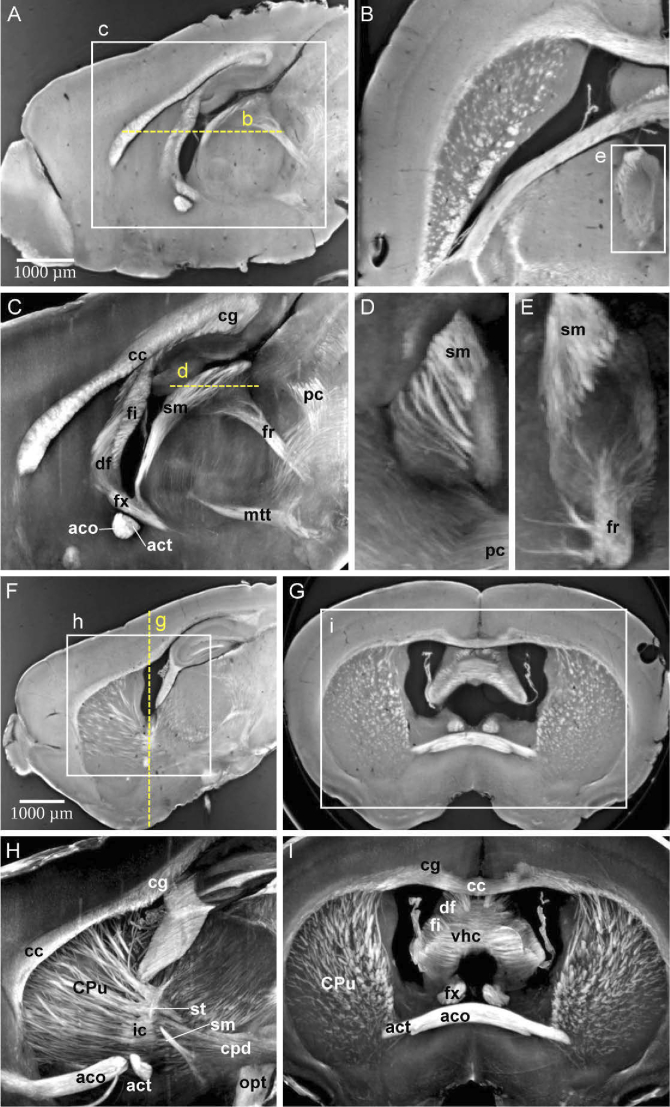
Fig. 2.
White matter fiber tracts are revealed by XPCT in a mouse brain. The same brain sample is shown in all panels from a mouse with LPC administration with a focus on normal-appearing white matter. (A) Sagittal view of single slice; (B) Corresponding axial view of single slice; (C) Maximum intensity projection (MIP) of sagittal view over 35 slices ( ), with white matter fiber tracts annotations; (D) MIP showing the entanglement between stria medullaris (sm) and the posterior commissure (pc); (E) MIP showing the entanglement between stria medullaris (sm) and the fornix (fr); (F) Sagittal view of single slice; (G) Corresponding coronal view; (H) Maximum intensity projection (MIP) of sagittal view over 35 slices ( ), with white matter fiber tract annotations; (I) MIP of coronal view over 35 slices ( ), with white matter fiber tract annotations; Labels: aco anterior commissure, olfactory limb; act anterior commissure, temporal limb; cc corpus callosum; cg cingulum; cpd cerebral peduncle; CPu caudate putamen; df dorsal fornix; fi fimbria; fr fasciculus retroflexus; fx columns of the fornix; mtt mammillothalmic tract; sm stria medularis; st stria terminalis; opt optical tract; pc posterior commissure.; vhc ventral hippocampal commissure.

