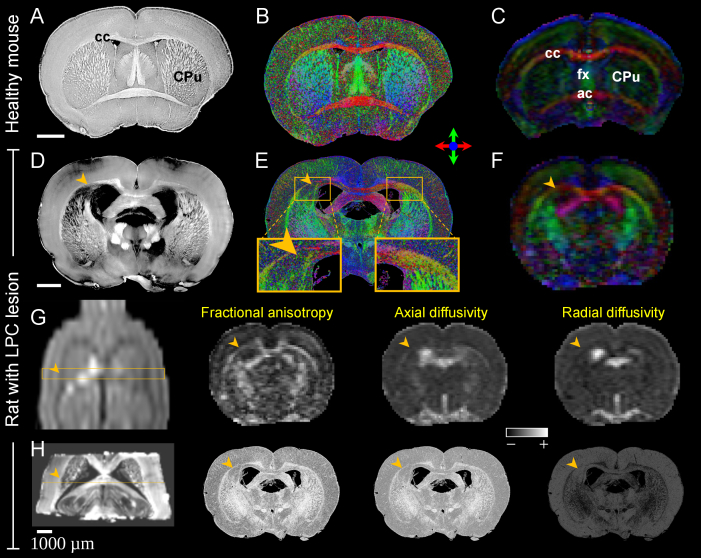
Fig. 6.
XPCT retrieves brain-wide structural connectivity in a DTI-like manner. (A) MIP over 5 slices ( ) of a healthy mouse brain (coronal view); (B) Color-coded direction map extracted from XPCT from the same data set (cf. Fig. S3); (C) Color-coded direction map from in vivo DTI obtained in the same mouse at the corresponding slice level. White-matter tract directions are identical between the two techniques within major white-matter tracts such as corpus callosum (cc), fornix (fx), anterior commissure (ac) and caudate putamen (CPu); (D) MIP over 10 slices ( ) of a rat brain with an LPC-induced lesion in the corpus callosum (coronal view, arrowhead); (E) Color-coded direction map extracted from XPCT from the same dataset. The loss in right-left directionality is clearly seen in the demyelinated area compared to the contralateral side (inserts); (F) Color-coded direction map from in vivo DTI obtained in the same rat at the corresponding slice level; (G) Native DTI data ( ) for a rat with an LPC lesion (coronal view). The box indicates DTI slice thickness ( ) and the arrow points to the area of demyelination. DTI metrics maps of this slice are shown in axial incidence. (H) MIP over 5 slices ( ) of XPCT image and DTI-like metrics maps corresponding to the slice indicated on the MIP (slice thickness: ).

