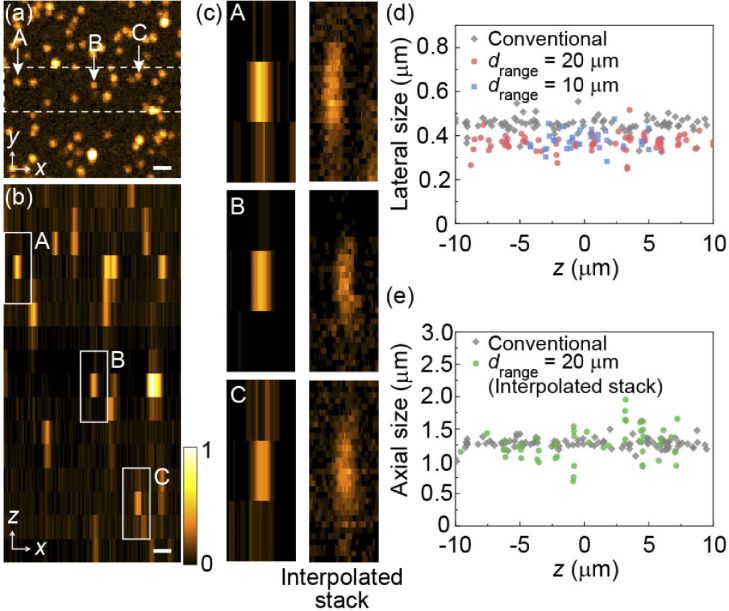
Fig. 3.
Imaging of 200-nm orange fluorescence beads embedded in agarose gel, reconstructed from a single 2D scan of a light needle with the observation depth drange = 20 µm. (a) Maximum intensity projection of the reconstructed 3D image. (b) The xz plane displayed as maximum intensity projection along the y axis within the region indicated by the white dashed rectangle in (a). The scale bars in (a) and (b) are 1 µm. The magnified views of the three representative beads (at z = 6, −0.67, and −7.33 µm) labeled A–C in (a) and (b) are shown in the left panels in (c). The right panels in (c) correspond to the images of the same beads obtained from the interpolated stack (see main text). Evaluated lateral and axial bead sizes of each bead as a function of the axial position are shown in (d) and (e), respectively.

