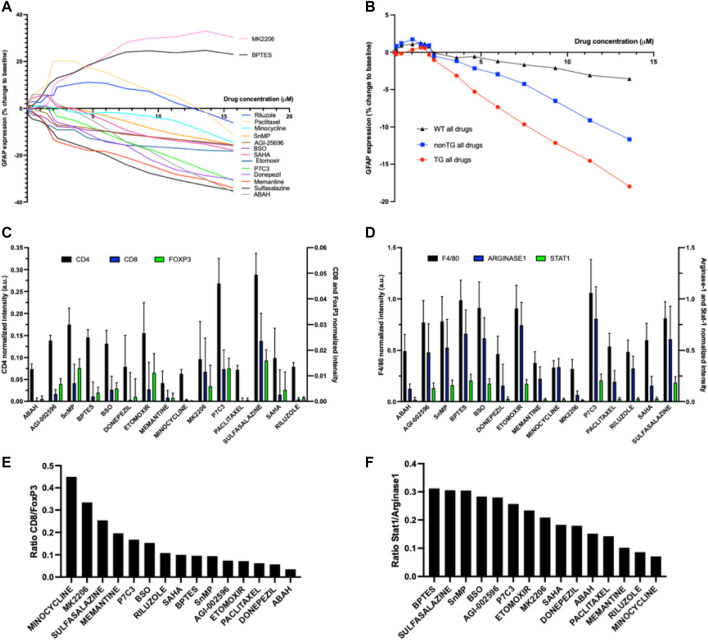
FIGURE 4.
(A) Precise PK/PD curves GFAP expression versus drug concentration for 15 individual drugs at 7 days (n = four to six per drug) (B) PK/PD for GFAP expression as a function of concentration for all drugs combined, compared across three animal models (C) and (D) Quantitative description of commonly used T-cell and macrophage markers, respectively, per individual drug region (n = four to six per drug) (E) Ratio of CD8 to FoxP3 in each region of drug activity to measure effects of each drug’s effect on T-cell state (F) Ratio of Stat1 to Arginase-1 FoxP3 in each region of drug distribution to measure each drug’s effect on macrophage polarization.

