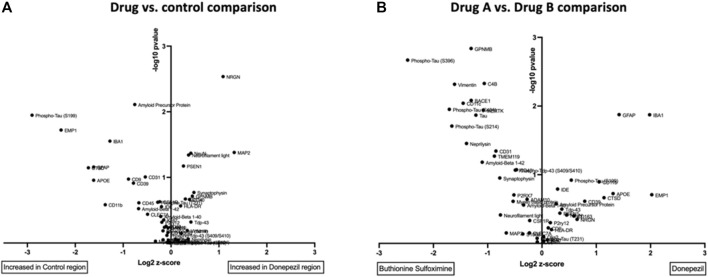
FIGURE 5.
(A) Volcano plot comparisons of expression of 56 protein markers in brain region treated with Donepezil vs control in TG model after drug exposure of 7 days (B) Direct comparison of marker expression between two drugs, Donepezil versus BSO in TG model. Each unit increase on x-axis represents a doubling in marker intensity. The y-axis shows the associated p-value (-log10) across the biological replicate set of n = four to six.

