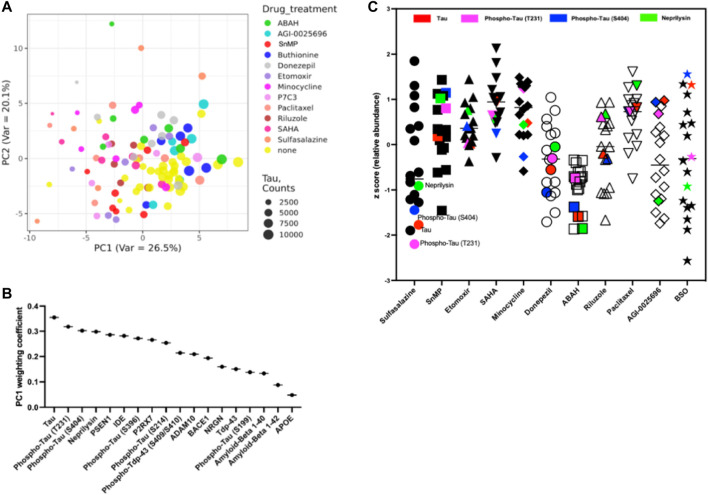
FIGURE 7.
(A) Principal component analysis reveals distinct phenotype of drug activity at t = 7 days (B) Identification of most significantly affected individual markers from principal component from all drugs tested in TG model (C) Drug effects in reduction of AD-associated markers (z-score). Highlighted are key markers of tauopathy (Tau: red; phospho-Tau T231: magenta; phospho-Tau T404: blue; and Neprilysin: green).

