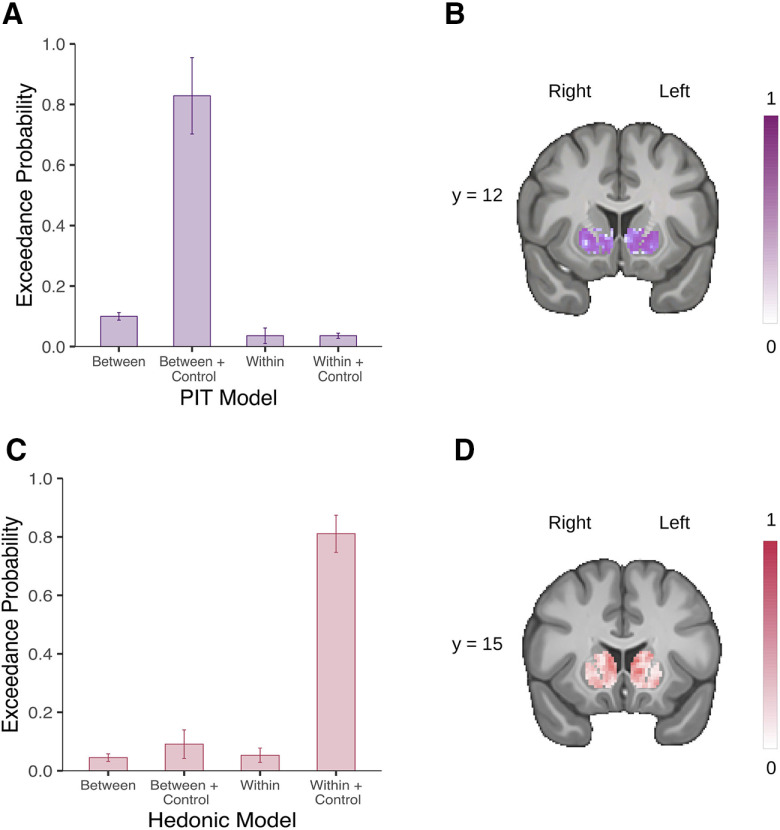
Figure 2.
Voxel-wise Bayesian model selection in the striatum. A, Mean exceedance probability across voxels within the striatum for the PIT models. B, Likeliest frequency map of the winning PIT model (Between + Control). C, Mean exceedance probability across voxels within the striatum for the hedonic models. D, Likeliest frequency map of the winning hedonic model (Within + Control). Scale bars show the proportion of subjects in which the winning model is the optimal model. Error bars indicate ±1 SD.

