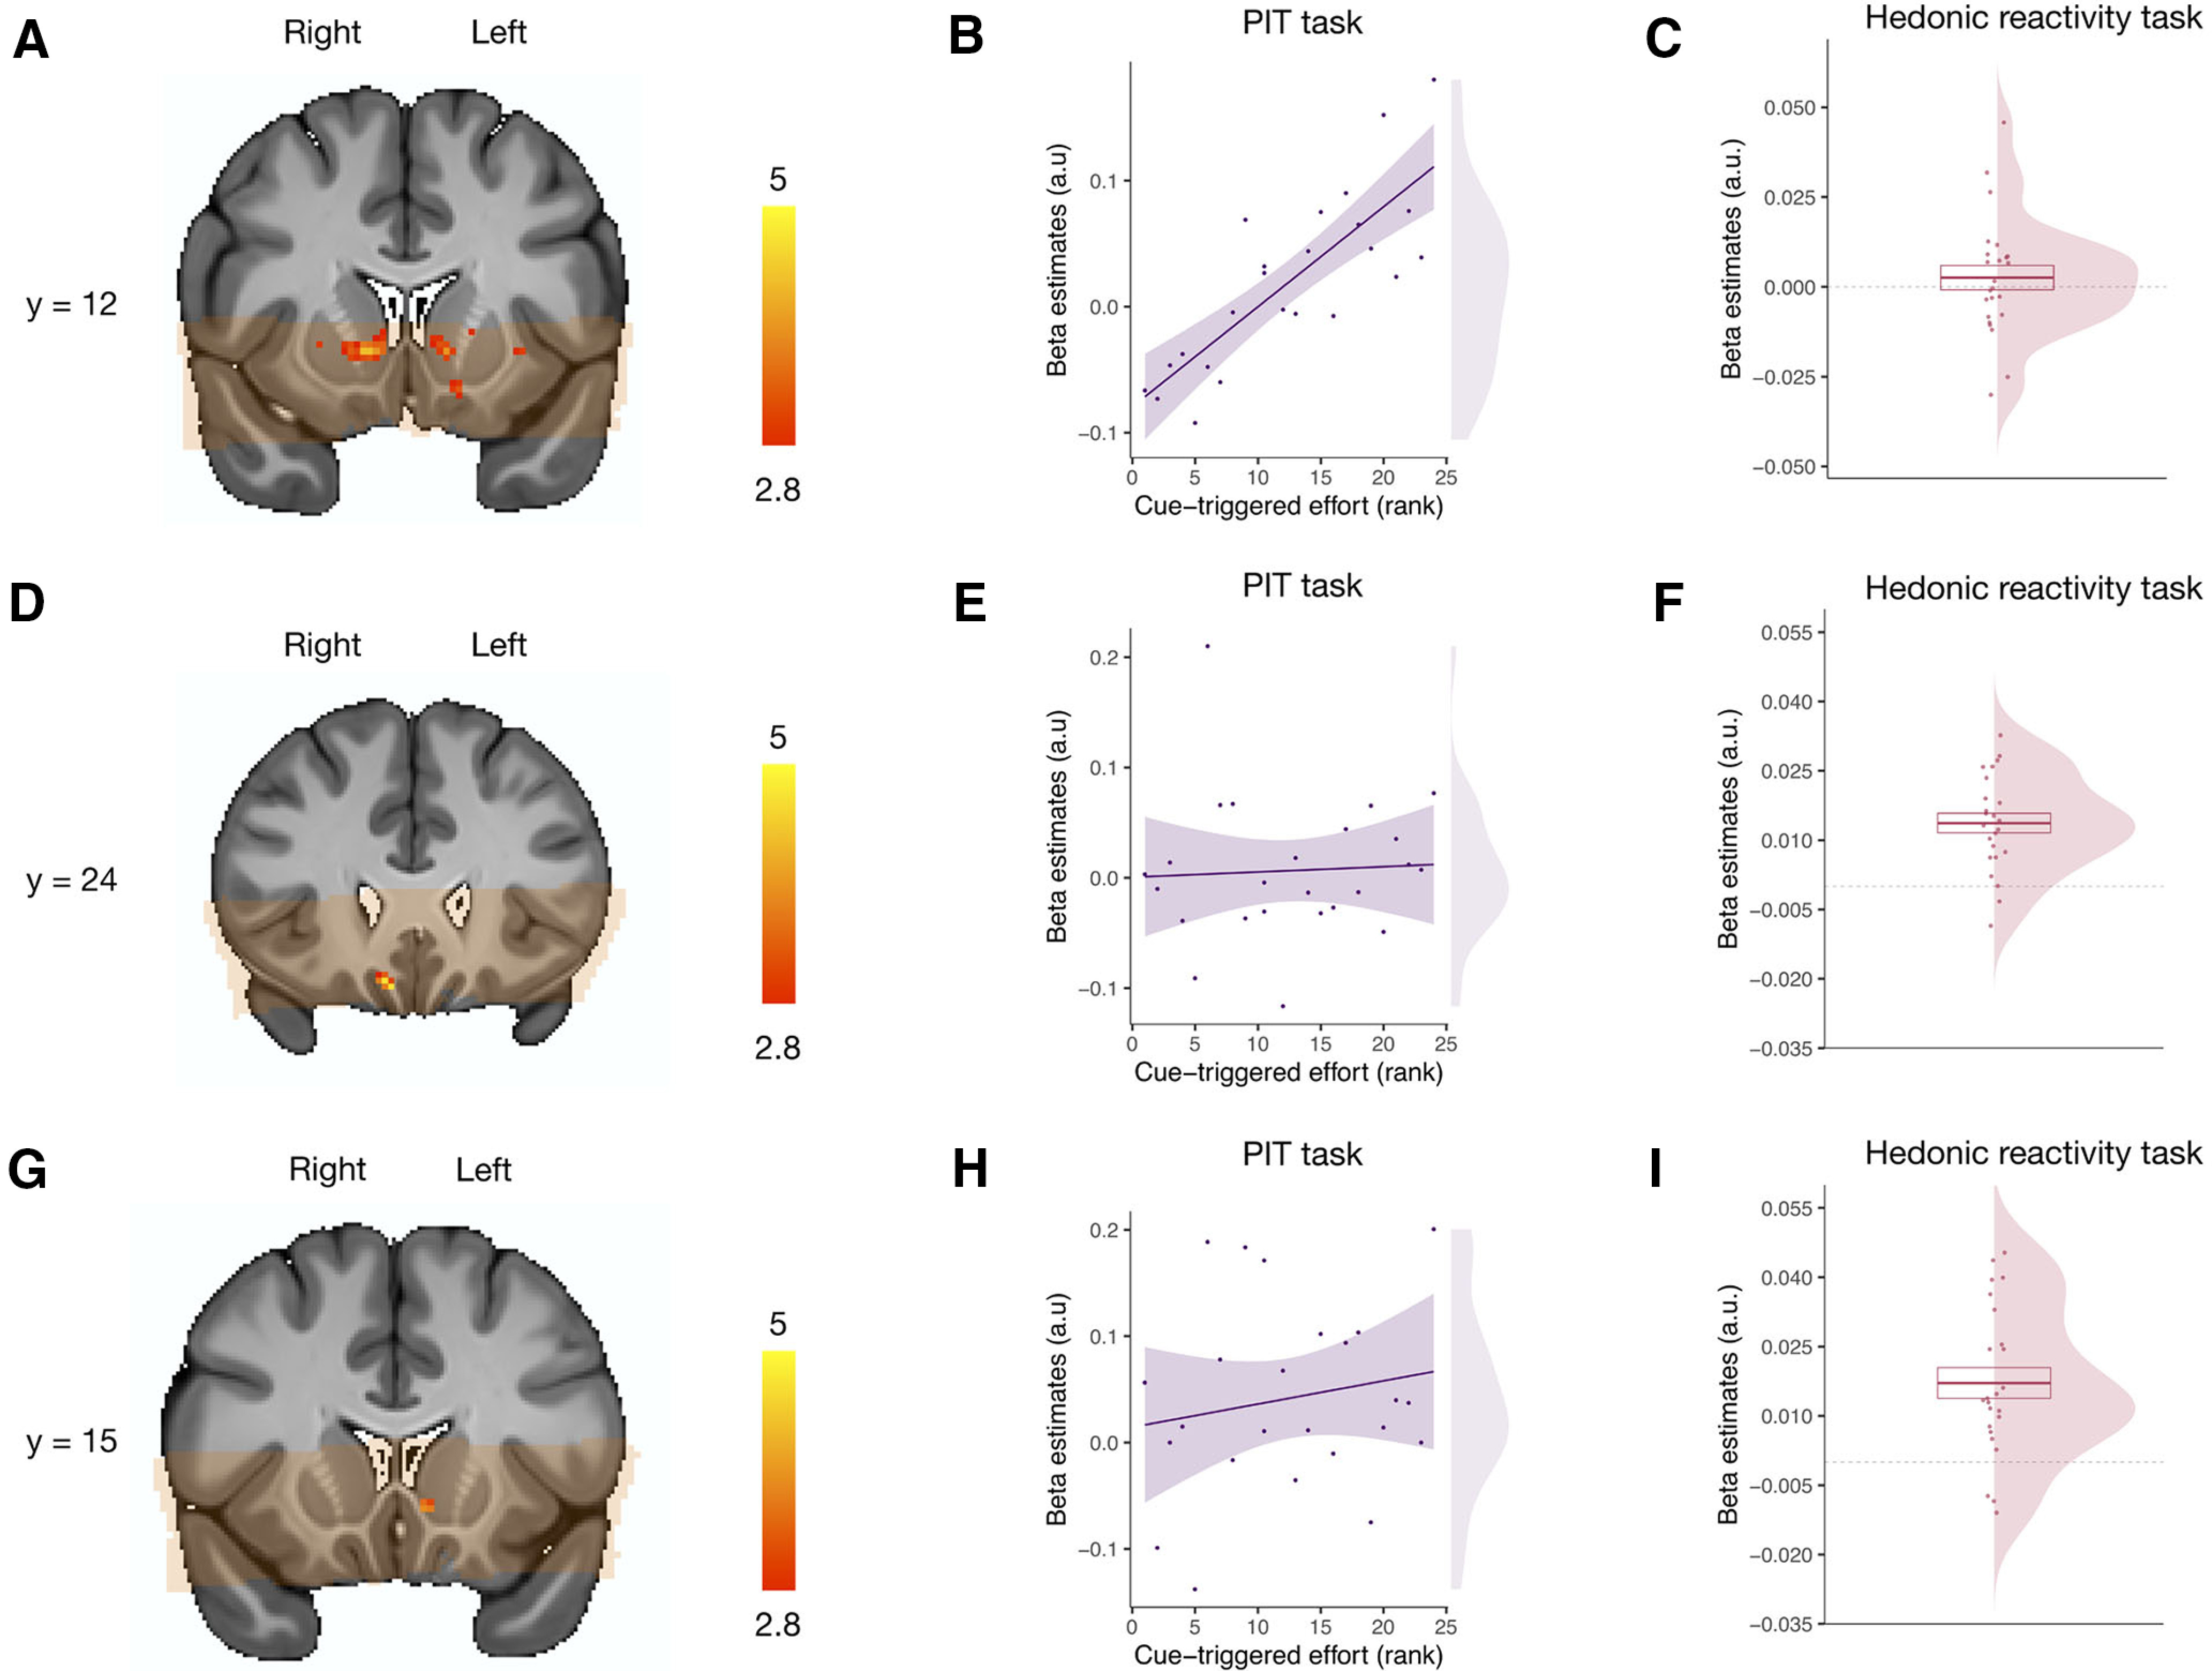
Figure 6.

Neural correlates of pavlovian-triggered motivation and of sensory pleasure. A, BOLD signal positively correlating with the magnitude of the PIT effect across participants in the VS. B, Scatter plot showing the pavlovian β estimates (CS+ > CS−) extracted from the voxels within the VS correlating with the PIT effect against the strength of the behavioral PIT for each participant. C, Overall mean across participants of the hedonic β estimates (pleasure modulator) extracted from the voxels within the VS correlating with the PIT effect. D, BOLD signal positively correlating with the magnitude of the hedonic pleasure experienced within participants in the mOFC. E, Scatter plot showing the pavlovian β estimates (CS+ > CS−) extracted from the voxels within the mOFC correlating with the hedonic experience against the strength of the behavioral PIT for each participant. F, Overall mean across participants of the hedonic β estimates (pleasure modulator) extracted from the voxels within the mOFC correlating with the hedonic experience. G, BOLD signal positively correlating with the magnitude of the hedonic pleasure experienced within participants within the VS. H, Scatter plot showing the pavlovian β estimates (CS+ > CS−) extracted from the voxels within the VS correlating with the hedonic experience against the strength of the PIT effect for each participant. I, Overall mean across participants of the hedonic β estimates (liking) extracted from the voxels within the VS correlating with the hedonic experience. Orange overlay indicates from which brain areas the fMRI data were acquired in all participants and were thus included in the statistical analysis. For display purposes, statistical t maps are shown with a threshold of p < 0.005, uncorrected. Scale bar shows t-statistic. Error bars indicate ±1 SEM adjusted for within-participants designs.
