Figure 5.
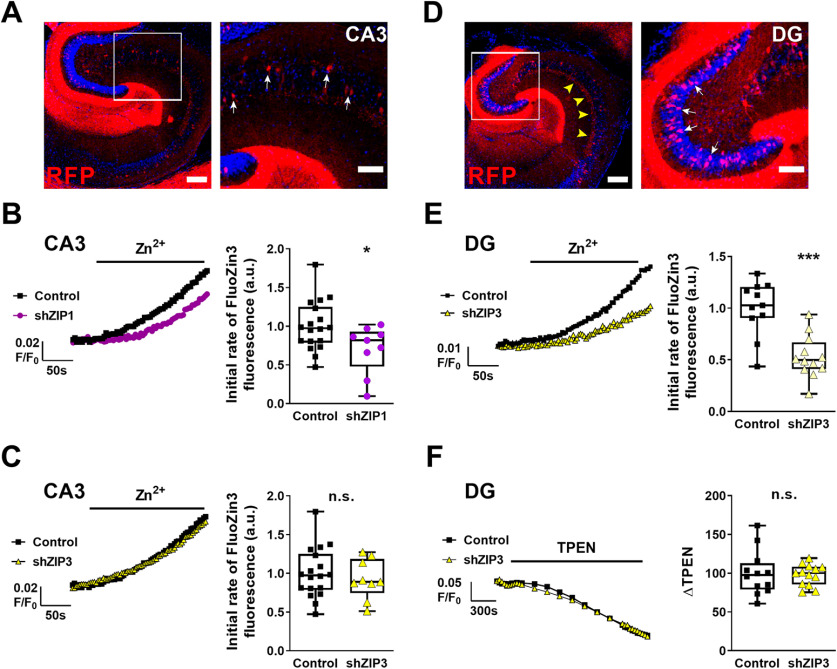
ZIP1 and ZIP3 are mediating Zn2+ uptake in distinct neuronal populations in hippocampus. A, Representative fluorescent images of acute hippocampal slices from mice transduced with AAV-RFP-shRNA ZIP1 (RFP, red), to knock-down ZIP1 expression, and stained with nuclear DAPI (blue). Left panel shows the whole hippocampus (scale bar: 250 µm), with CA3 region marked by box, and right panel shows a zoom-in of the CA3 region (scale bar: 100 µm). RFP-positive CA3 pyramidal neurons (e.g., white arrows in right panel) express the silencing construct. B, C, Matching slices were loaded with FluoZin-3, and signals were monitored in RFP-positive cells, to monitor Zn2+ transport. Representative traces show FluoZin-3 fluorescence from slices transduced with shZIP1 (magenta trace, B), shZIP3 (yellow trace, C) or control vector (black trace) in left panels. Averaged initial slope quantification of Zn2+ accumulation in CA3 pyramidal neurons is shown in the corresponding right panels. D, Representative fluorescent images of acute slices transduced with AAV-RFP-shRNA vectors aimed to silence ZIP3 (red). Left panel shows the whole hippocampus (scale bar: 250 µm), with DG marked in box. Note expression of RFP fluorescence in the stratum lucidum of CA3 (e.g., yellow arrowheads). Right panel is a zoom-in on the DG cells (scale bar: 100 µm), RFP-positive DG granule cells express the silencing construct (e.g., white arrows in right panel). E, FluoZin-3 fluorescent signals were monitored in RFP-positive cells expressing shZIP3 (yellow trace) or control (black trace) vector. Representative traces are shown in the left panel and averaged initial slope quantification of Zn2+ accumulation in DG granule neurons is shown in the corresponding right panel. F, Slices from shZIP3 transduced animals were loaded with the vesicular Zn2+ sensitive dye ZP1. Baseline fluorescent signal was acquired and the Zn2+ chelator TPEN (40 μm) was added as marked. Representative traces are shown in the left panel, and the averaged difference between baseline fluorescent signal and the signal at 30 min following application of TPEN, ΔTPEN, is shown in the right panel (*p ≤ 0.05, ***p ≤ 0.001, n.s: non significant; using t test; n = 9–12 hippocampal slices from 3 animals for each group).

