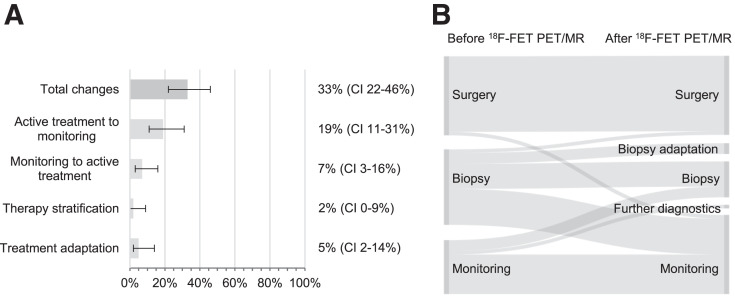
FIGURE 2.
(A) Frequency (percentage with 95% CIs) of clinical management changes based on 18F-FET PET/MRI outcome at new tumor diagnosis. Categories are as explained in Table 1. (B) Sankey diagram showing therapies recommended before and applied after 18F-FET PET/MRI at new diagnosis.

