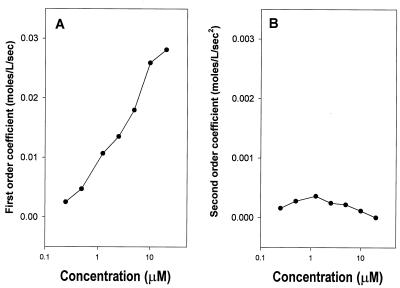
FIG. 3.
First- (A) and second (B)-order coefficients for polynomials describing the rate of ONP production shown in Fig. 2B. The vertical axes are scaled so that points at identical positions in both graphs would make equal quantitative contributions to the amount of ONP produced at 10 min.

