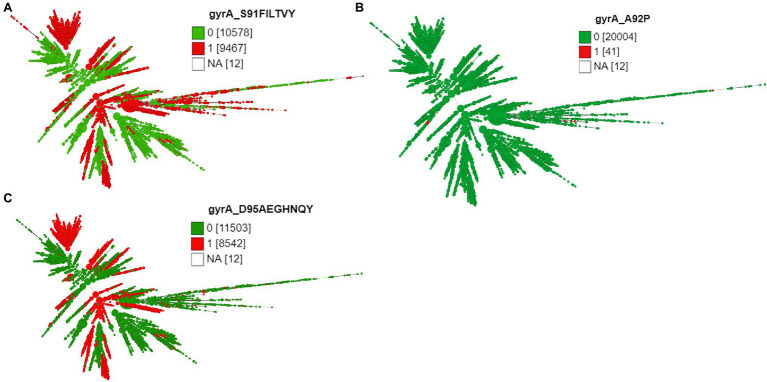
Figure 4.
Minimum spanning tree comparing core-genome allelic profiles with GyrA substitutions at amino acid (A) position 91, (B) position 92, and (C) position 95. Numbers in brackets refer to the number of isolates. 1 and 0 denotes the presence and absence of RAMs, respectively. Isolates are displayed as circles. The size of each circle indicates the number of isolates of this particular type.

