
FIGURE 2.
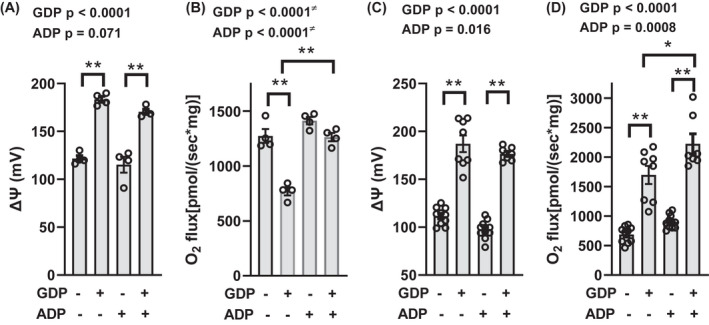
ΔΨ and O2 flux in IBAT mitochondria energized by complex I or complex II substrates. Panels (A and B) ΔΨ and O2 flux energized by 5 mM pyruvate +1 mM malate. Panels (C and D) ΔΨ and O2 flux energized by 10 mM succinate. Mitochondria were incubated for 20 min in the presence or absence of 1 mM GDP and/or 32 µM ADP as indicated below the x‐axis. n = 4 for panels A and B, n = 7–11 for panels C and D. Data were analyzed by two‐factor (GDP × ADP) ANOVA. Factor significance is shown above the panels. *p < 0.01, **p < 0.001 for multiple comparisons as indicated. ≠ Interaction is significant, so the interpretation of p values is confounded. Data represent individual values, mean, and SE