
FIGURE 7.
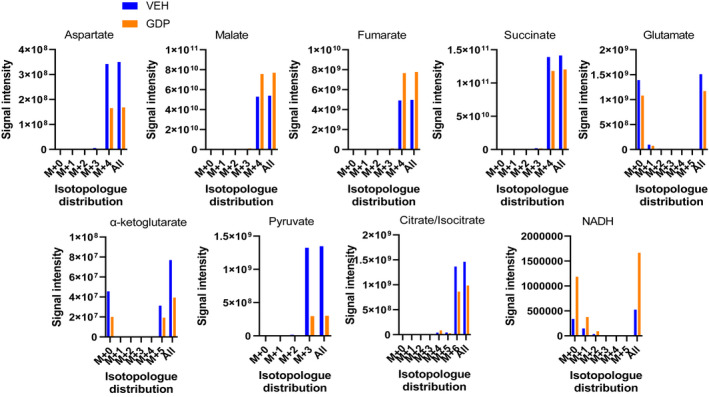
[13C] isotopomer flux analyses. Data depict the effect of 1 mM GDP versus vehicle on relative signal intensities and isotopologue distribution for several TCA metabolites. IBAT mitochondria were energized by 10 mM [U‐13C] succinate plus unlabeled 0.5 mM glutamate in the presence of 32 µM ADP and incubated in the Oxygraph respirometer for 20 min in the presence or absence of 1 mM GDP. Incubates were subject to LC‐MS to determine signal strength (y‐axis) and isotopologue distribution (x‐axis)