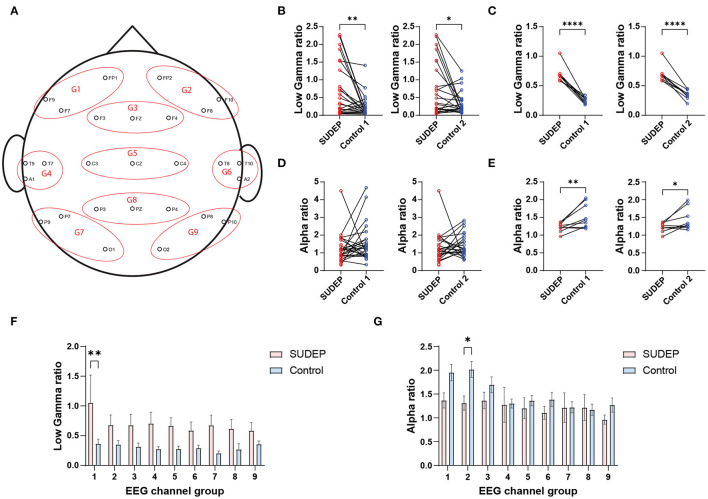
Figure 1.
(A) Clustering scalp electroencephalography (EEG) electrodes (10–20 International System) into nine channel groups (G1–G9). (B) Comparison of channel-averaged EEG low gamma sleep/wake power ratios between SUDEP Patients and age-matched living epilepsy controls (SUDEP vs. control 1, **p = 0.0033, paired t-test; SUDEP vs. control 2, *p = 0.0251). (C) Comparison of subject-averaged EEG low gamma sleep/wake power ratios between SUDEP patients and age-matched living epilepsy controls (****, p < 0.0001, paired t-test). (D,E) Similar to panels (B,C) except for the alpha band [panel (D): n.s., p = 0.258 and p = 0.719; panel (E): **p = 0.009 and *p = 0.039, paired t-test]. (F) Comparison of EEG low gamma sleep/wake power ratios between SUDEP patients and age-matched controls in nine EEG channel groups (**, p = 0.0012, two-way ANOVA test; error bar denotes SEM). (G) Similar to panel F, except for the alpha band (**, p = 0.048, two-way ANOVA test).

