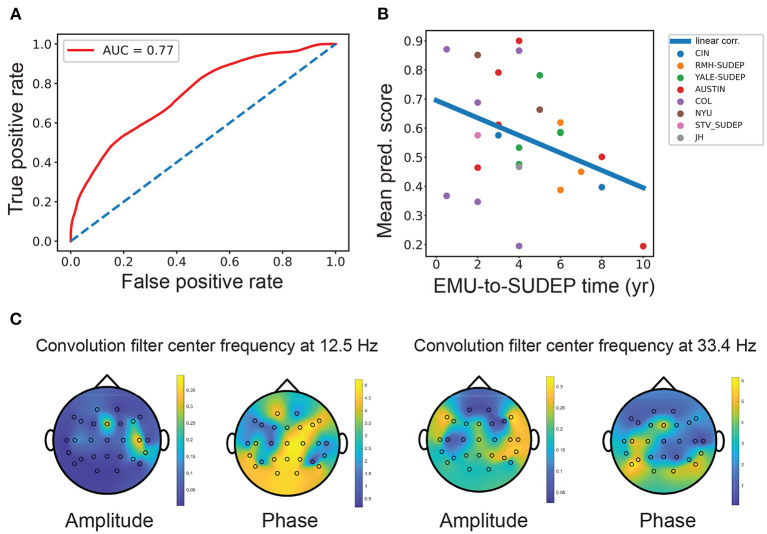
Figure 2.
(A) Mean receiver operating characteristic (ROC) curve [mean area under the curve (AUC) = 0.77, interquartile range (IQR): 0.73–0.80; LR classifier] obtained from SUDEP vs. non-SUDEP classification based on combined EEG and ECG features. Diagonal line shows the chance level (AUC = 0.5). (B) The mean SUDEP prediction score correlated negatively with the EMU-to-SUDEP time among the SUDEP group (Pearson's correlation ρ =-0.38, n = 26). Color-coded points represent patients from 8 different centers. (C) Visualization and projection of two pairs of convolutional filters in the CNN onto the brain topographies of spatial patterns. The spatial patterns of “amplitude map” indicate the importance at specific channels, whereas the spatial patterns of “phase shift map” indicate the relative phase lagging.

