Figure 2.
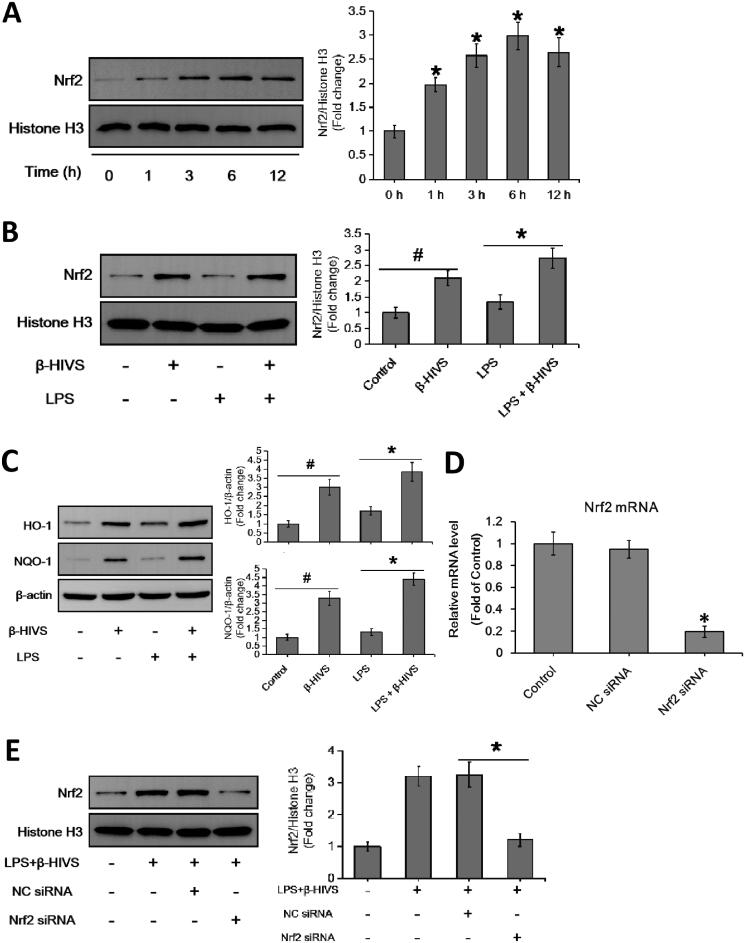
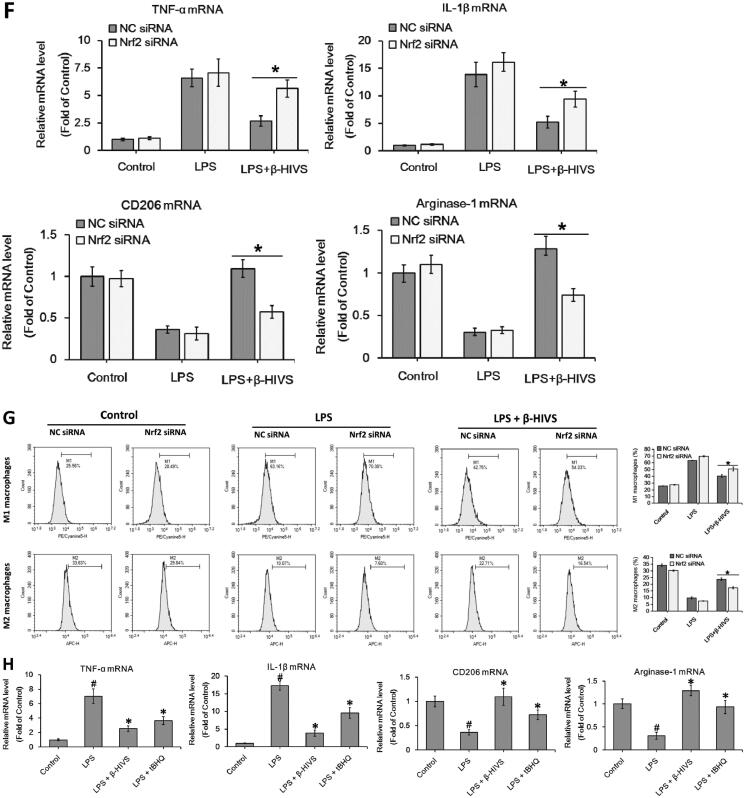
β-HIVS regulates macrophage polarization through the activation of Nrf2 signalling. (A) RAW 264.7 cells were incubated with 1 μM β-HIVS for different time periods. Then, Western blot analysis was used to detect the levels of nuclear Nrf2. *p < 0.05 compared with the ‘0 h’ group. (B,C) The cells were incubated with 1 μM β-HIVS for 1 h, followed by 100 ng/mL LPS for another 3 h (B) or 24 h (C). Then, Western blotting was performed to detect the levels of nuclear Nrf2, HO-1, and NQO-1. #p < 0.05 and *p < 0.05 vs. the control and LPS alone groups, respectively. (D) The cells were incubated with Nrf2 siRNA or control siRNA (NC) for 24 h, and then subjected to the detection of relative mRNA levels of Nrf2 using real-time PCR assay. *p < 0.05 vs. the NC siRNA group. (E–G) After 48 h of Nrf2 siRNA transfection, the cells were incubated with 1 μM β-HIV for 1 h, followed by 100 ng/mL LPS for another 3 h (E) or 24 h (F,G). Western blot assay (E) was used to examine the levels of nuclear Nrf2, real-time PCR assay (F) and flow cytometry assay (G) were used to examine the changes in macrophage polarization, respectively. *p < 0.05 vs. the NC siRNA group. (H) The cells were incubated with 1 μM β-HIVS or 100 μM tBHQ for 1 h, followed by 100 ng/mL LPS for an additional 24 h. Then, real-time PCR assay was conducted to measure the mRNA levels of M1 and M2 marker genes. #p < 0.05 and *p < 0.05 vs. the control and LPS alone groups, respectively.


