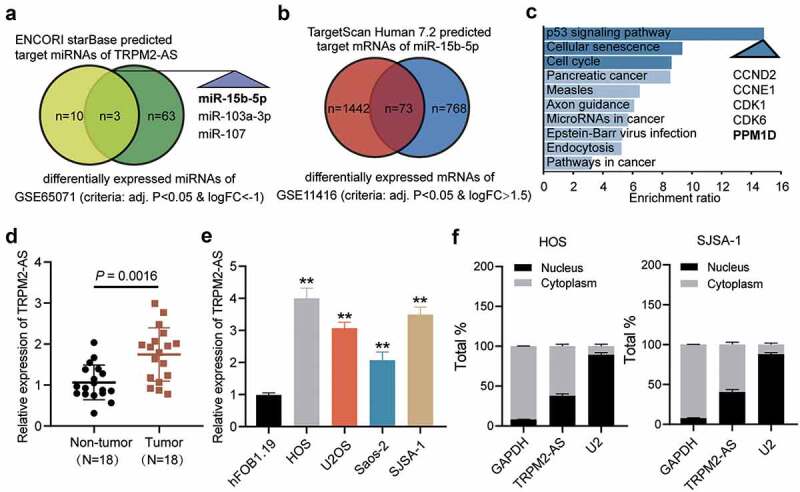
Figure 1.

Identification of miR-15b-5p and PPM1D as study objects. (a) Venn diagram showing the intersection between the TRPM2-AS target miRNAs predicted via the ENCORI starBase (http://starbase.sysu.edu.cn) and the differentially expressed miRNAs of the GSE65071 data series with the criteria of adjusted P < 0.05 and log FC < −1. FC: fold change. (b) Venn diagram showing the intersection between the target miR-15b-5p mRNAs predicted via TargetScan Human 7.2 (http://targetscan.org/vert_72) and the differentially expressed mRNAs of the GSE11416 data series with the criteria of adjusted P < 0.05 and log FC > 1.5. (c) Bar graph showing the enriched KEGG pathways that the intersected genes in Figure 1(b) were involved in. (d) TRPM2-AS expression in osteosarcoma and corresponding non-tumor tissues derived from 18 OS patients, as measured via RT-qPCR. (e) TRPM2-AS expression in osteosarcoma cell lines (HOS, U2OS, Saos-2, and SJSA-1) and human normal osteoblast cell line (hFOB1.19), as measured via RT-qPCR. GAPDH served as a control. The relative target gene level was calculated by normalizing them to GAPDH in each group to its corresponding value in the hFOB1.19 group. **P < 0.001 compared with the hFOB1.19 cells. (f) Intracellular distribution of TRPM2-AS in HOS and SJSA-1 cells, determined by detecting the nuclear and cytoplasmic TRPM2-AS expression via RT-qPCR. Data are represented as the mean ± SD. All cellular experiments were performed in triplicates.
